Understanding costs and how they change with output is critical for pricing, profit planning and making decisions about expansion.
Types of cost
- Fixed costs – costs that do not change with the level of output. Examples include rent on the premises, insurance premiums and salaries for permanent staff. These costs must be paid even if nothing is produced.
- Variable costs – costs that vary directly with the level of output. Raw materials for each unit produced and piece‑rate wages are typical examples: doubling production will roughly double these costs.
- Total cost – the sum of fixed costs and variable costs at a given level of output.
- Average cost (unit cost) – the total cost divided by the number of units produced. It shows the cost per unit and helps firms set prices.
- Revenue – the income received from selling goods or services (price × quantity).
- Semi‑variable costs – costs that contain both fixed and variable elements. A telephone bill often has a fixed line rental plus variable call charges; electricity supply may include a standing charge plus usage‑based costs.
- Direct costs – costs that can be traced directly to each unit produced, such as the raw materials used in a cake or the wages of assembly‑line workers making a product.
- Indirect costs (overheads) – costs that cannot be linked to a specific unit and are shared across the business. Factory rent, office administration salaries and utilities are common examples. These need to be allocated when calculating total and average cost.
Economies and diseconomies of scale
As firms grow, they may benefit from economies of scale, leading to lower average costs. These include:
- Purchasing economies – buying inputs in bulk at discounted prices.
- Marketing economies – spreading advertising costs over more output.
- Financial economies – borrowing at lower interest rates due to lower risk.
- Managerial economies – employing specialist managers to improve efficiency.
- Technical economies – using more efficient, large‑scale machinery.
- Risk‑bearing economies – diversifying products or markets to spread risk.
If a firm becomes too large, diseconomies of scale may occur, increasing average costs. Causes include communication problems, low employee motivation and bureaucracy.
Break‑even analysis
Break‑even analysis helps businesses determine the level of output at which total revenue equals total cost (the break‑even point). It is calculated as:
\(\text{Break‑even output} = \frac{\text{Fixed costs}}{\text{Selling price per unit} - \text{Variable cost per unit}}\)
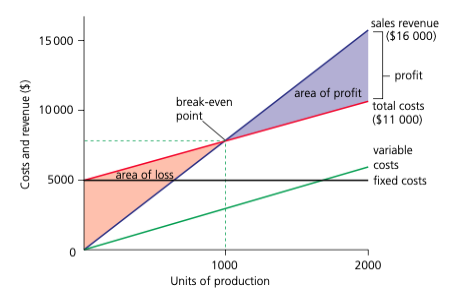
On a break‑even chart, the point where the total revenue and total cost lines intersect shows the break‑even output. The gap between total revenue and total cost above this point represents profit; below it, loss. The difference between actual sales and break‑even sales is the margin of safety.
Break‑even analysis aids decision making on pricing, output levels and whether new products are viable. However, it relies on assumptions such as constant selling price and linear costs, which may not hold in reality.
Need help drawing the chart? Watch a step‑by‑step video tutorial on break‑even charts here.
| Economy | Description | Example |
|---|---|---|
| Purchasing | Lower unit costs by buying inputs in bulk. | Supermarket obtains discounts when ordering large quantities. |
| Marketing | Advertising costs spread over larger output. | National advertising campaigns reach many customers. |
| Financial | Borrowing at lower interest rates due to size and lower perceived risk. | Large corporations obtaining cheaper loans than small firms. |
| Managerial | Employing specialist managers to improve efficiency. | Dedicated HR, finance or marketing managers reduce errors and increase output. |
| Technical | Using large‑scale technology to produce more efficiently. | Automated assembly lines reduce per‑unit costs. |
| Risk‑bearing | Diversifying product range or markets to spread risk. | Conglomerate businesses that operate in multiple industries. |
Examples and applications
Imagine a small café selling cupcakes for $2 each. Fixed costs like rent and utilities amount to $1,000 per month and variable costs (ingredients and packaging) are $0.80 per cupcake. The contribution per cupcake (selling price minus variable cost) is $1.20, so the break‑even output is 1,000 ÷ 1.20 ≈ 834 cupcakes. This means the café must sell about 834 cupcakes each month to cover all costs; sales beyond this level generate profit.
Economies of scale can be seen when a factory expands production from 1,000 to 10,000 units per month. Ordering materials in bulk reduces the cost per unit, and specialised machinery and managers increase efficiency. However, if the factory grows too large, communication and coordination may suffer, causing diseconomies of scale like slower decision making and lower employee morale. Break‑even analysis is a useful planning tool but managers should remember that costs and prices can change, and not all products sell at the same rate.