The production possibility curve
The production possibility curve (PPC) shows the maximum combinations of two goods or services that an economy can produce using all its resources efficiently. Points on the curve represent efficient production, points inside the curve represent under‑utilised resources and points outside the curve are unattainable with the current resources and technology.
The PPC is usually drawn concave to the origin, reflecting the law of increasing opportunity cost: as more of one good is produced, the opportunity cost in terms of the other good rises because resources are not perfectly adaptable between uses. Economic growth, improved technology or an increase in the quantity or quality of factors of production shift the curve outward, enabling higher potential output.
Figure 4.1 – Production possibility curve (PPC) diagram
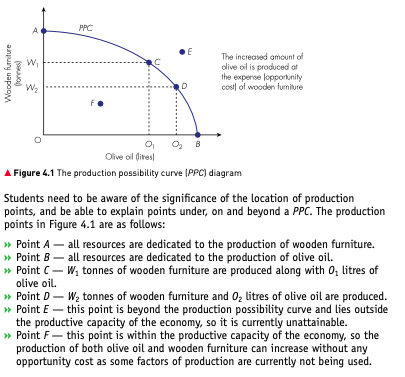
This diagram illustrates the trade‑off between producing wooden furniture and olive oil. At one extreme (point A), all resources are dedicated to producing wooden furniture; at the other extreme (point B) they are all used for olive oil. Intermediate points such as C and D show efficient combinations of both goods. Point F lies inside the curve and represents idle or inefficient use of resources, whereas point E lies beyond the curve and is unattainable given current resources and technology.
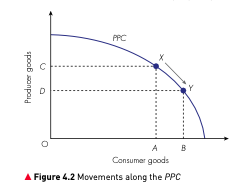
Figure 4.2 – Movements along the PPC
| Position on PPC | Interpretation |
|---|---|
| On the curve | Resources are fully employed and used efficiently |
| Inside the curve | Resources are idle or used inefficiently |
| Outside the curve | Currently unattainable with existing resources and technology |
| Outward shift | Economic growth or improvements in resources or technology increase potential output |
Shifts of the PPC
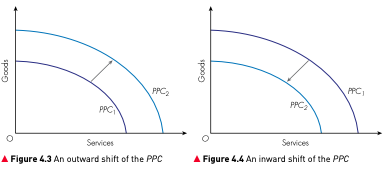
An outward shift of the PPC occurs when there is economic growth. This can come about through improvements in the quality of factors of production, such as better education and training or technological advances, or through an increase in their quantity, for example the discovery of new resources. These improvements allow more goods and services to be produced, shifting the PPC from PPC1 to PPC2.
An inward shift reflects a fall in productive capacity when resources are lost or destroyed. Detrimental events, such as natural disasters, wars or other shocks, reduce the economy’s ability to produce goods and services and shift the PPC inward.
Understanding the PPC helps explain the benefits of economic growth and the cost of allocating resources between competing uses. It also highlights the importance of efficiency in maximising welfare given scarce resources.