The concept of demand
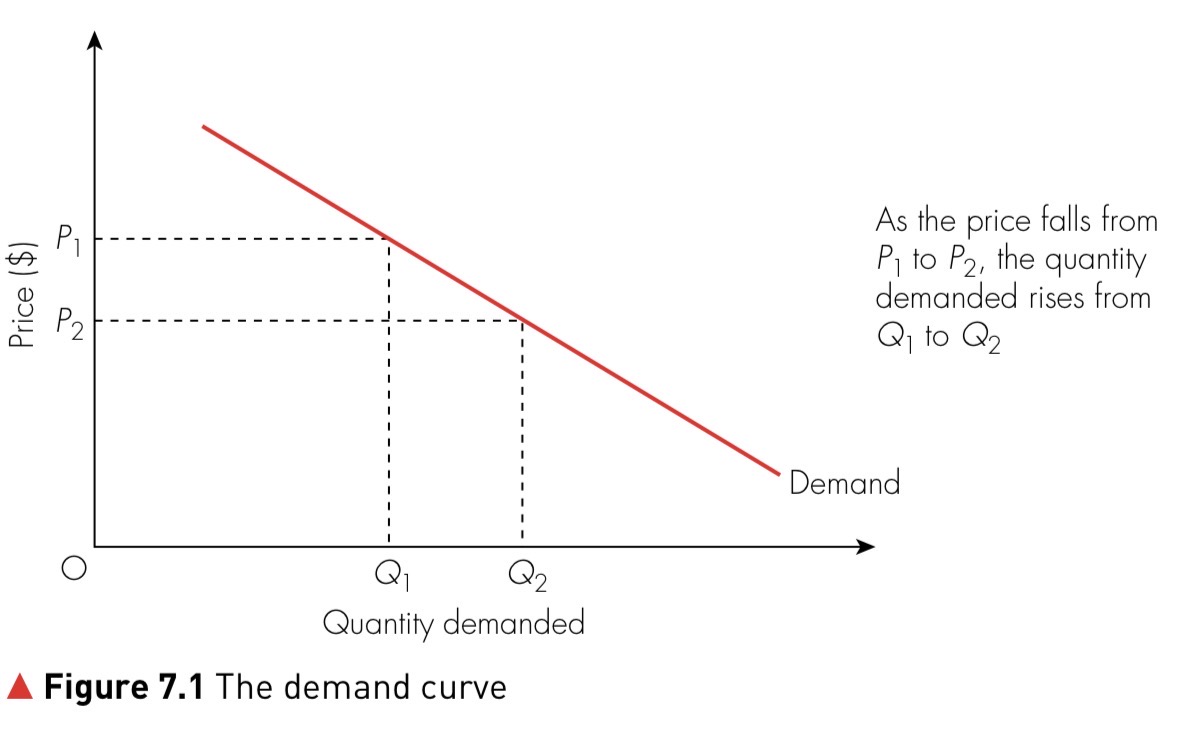
Demand refers to the quantity of a good or service that consumers are willing and able to buy at various prices over a period of time. The law of demand states that, ceteris paribus (all else being equal), there is an inverse relationship between price and quantity demanded: when the price of a good rises, the quantity demanded falls, and when the price falls, demand increases. This relationship is illustrated by the downward‑sloping demand curve.
Determinants of demand
Several factors other than price influence the demand for a product:
- Income – higher disposable income generally increases demand for normal goods but reduces demand for inferior goods.
- Tastes and preferences – changes in fashion or consumer preferences can shift demand.
- Prices of related goods – a rise in the price of substitutes (e.g. Pepsi) increases demand for the good (e.g. Coca‑Cola), while a rise in the price of complements (e.g. printers) decreases demand for the good (e.g. ink cartridges).
- Expectations – expectations of future price changes or income can affect current demand.
- Population and demographic changes – a growing population or changes in age structure affect overall market demand.
| Factor | Effect on demand |
|---|---|
| Increase in income (normal good) | Demand curve shifts right; consumers buy more at every price |
| Decrease in income (inferior good) | Demand curve shifts right as consumers substitute towards the inferior good |
| Higher price of substitute | Demand for the good rises |
| Higher price of complement | Demand for the good falls |
| Positive advertising campaign | Raises consumer preferences and increases demand |
Movements along the demand curve
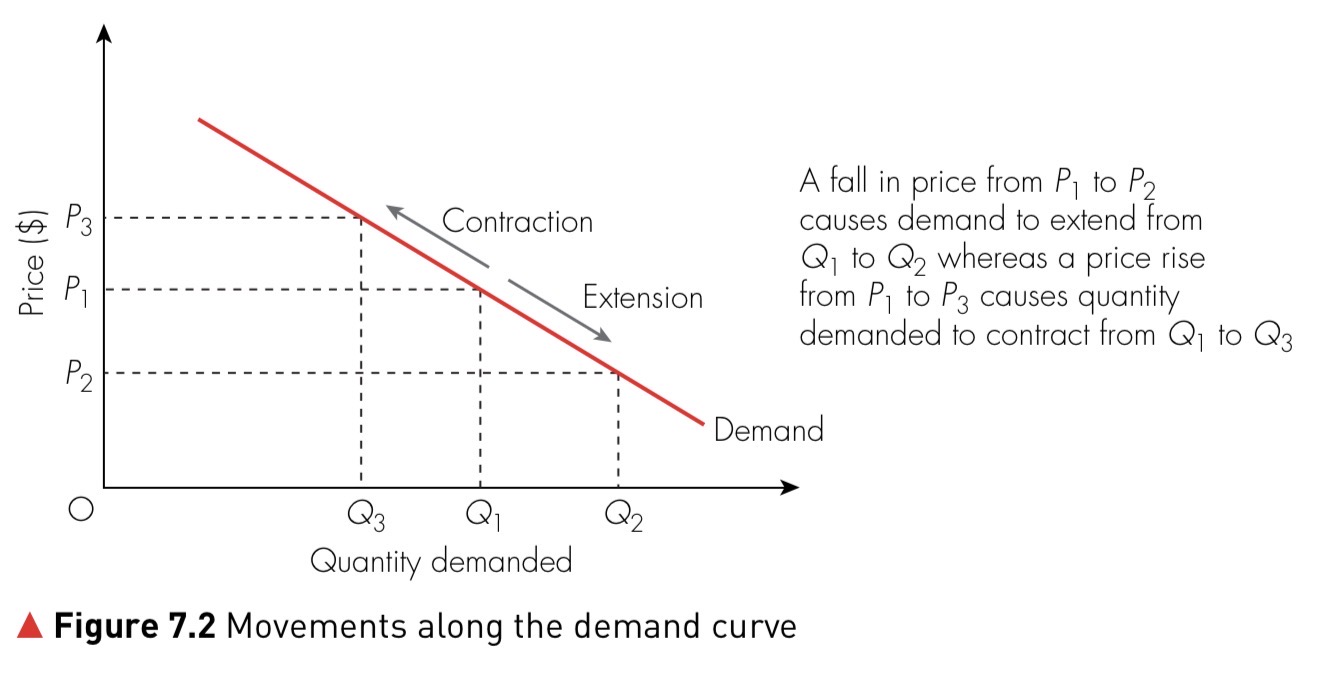
A change in the price of a good or service causes a movement along the demand curve. A price increase leads to a contraction of demand — the quantity demanded falls. Conversely, a price decrease leads to an extension of demand — the quantity demanded increases.
The market demand curve
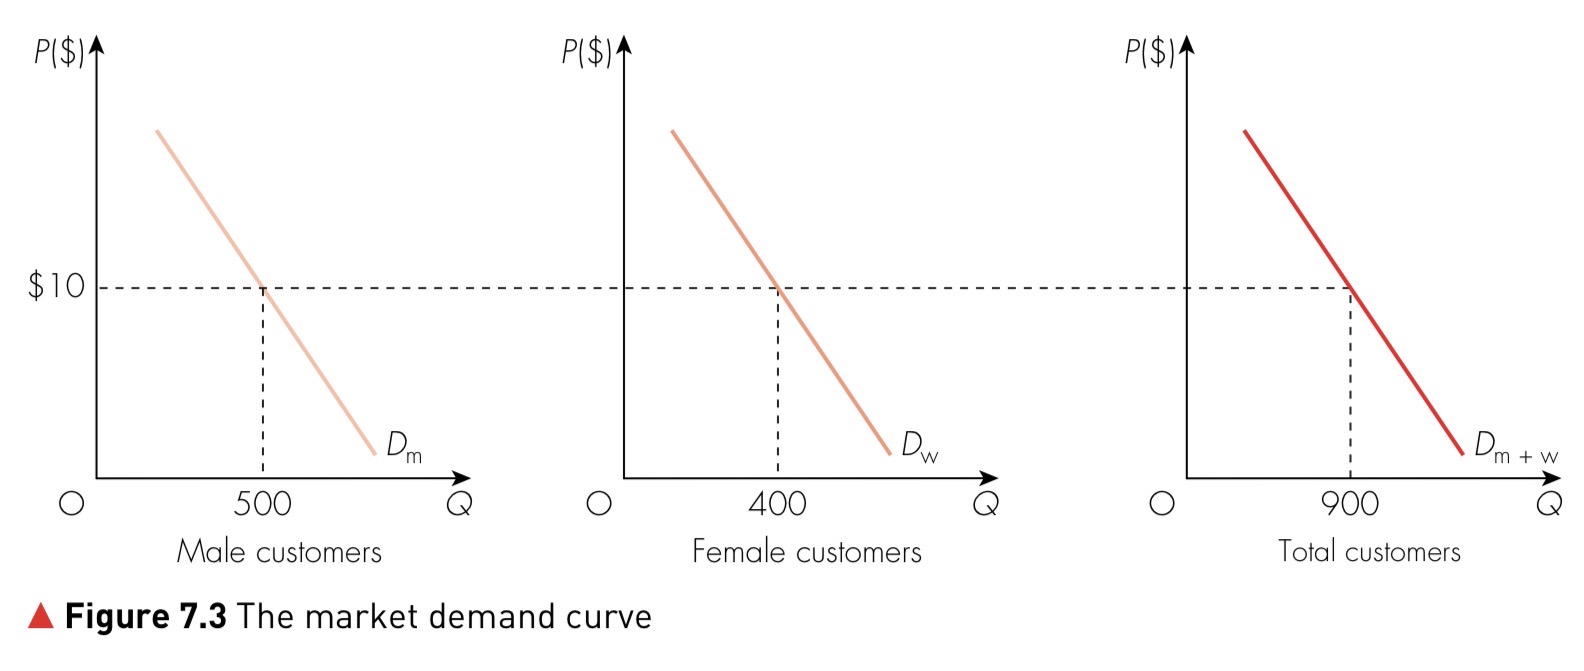
The market demand curve is the aggregation of all individual demand for a product at each price level. It is found by adding together the quantities demanded by different groups of consumers for each possible price, giving the total quantity demanded in the market.
Shifts in the demand curve
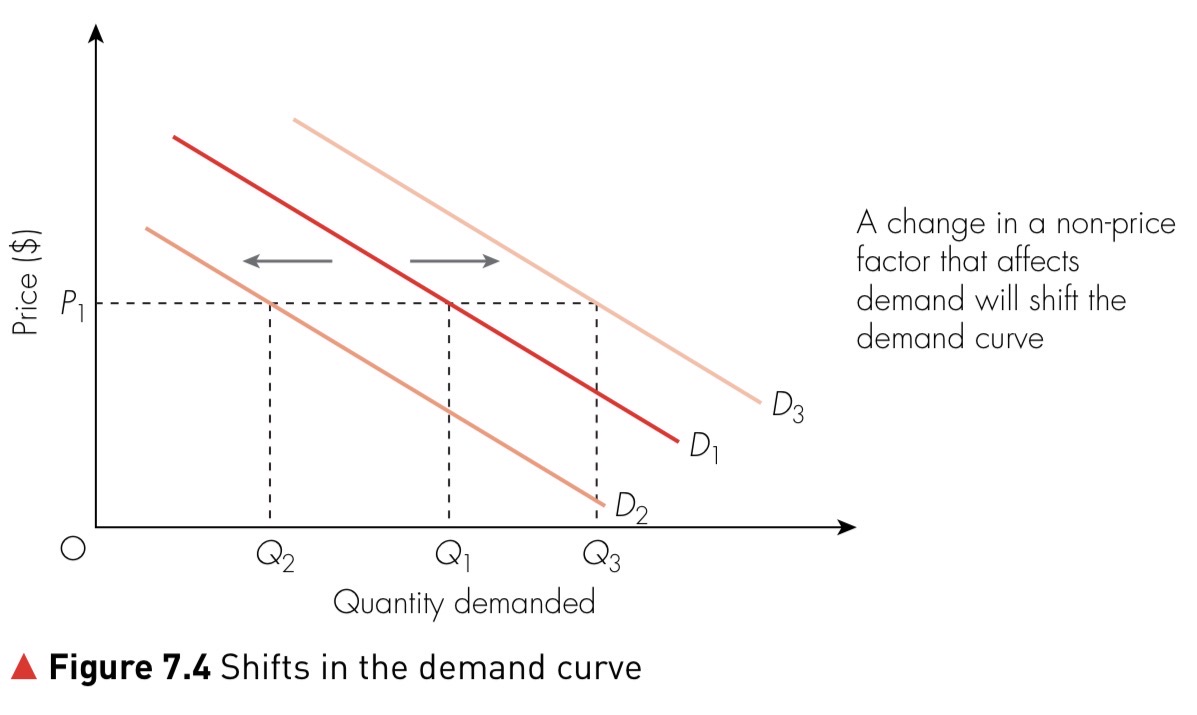
While movements in demand are caused by price changes, shifts in the demand curve occur when non‑price factors change. An increase in demand, represented by a rightward shift of the curve, means a higher quantity is demanded at every price. This can result from higher disposable income, positive changes in tastes and preferences, higher prices of substitutes, lower prices of complements or successful advertising campaigns. By contrast, a decrease in demand, shown by a leftward shift, occurs when less is demanded at every price — often due to falling incomes, higher unemployment or a fall in the price of substitutes.
It is important to distinguish between a movement along the demand curve (caused by price changes) and a shift of the demand curve (caused by changes in non‑price determinants). Understanding this distinction is crucial for analysing how markets respond to economic events.