The concept of supply
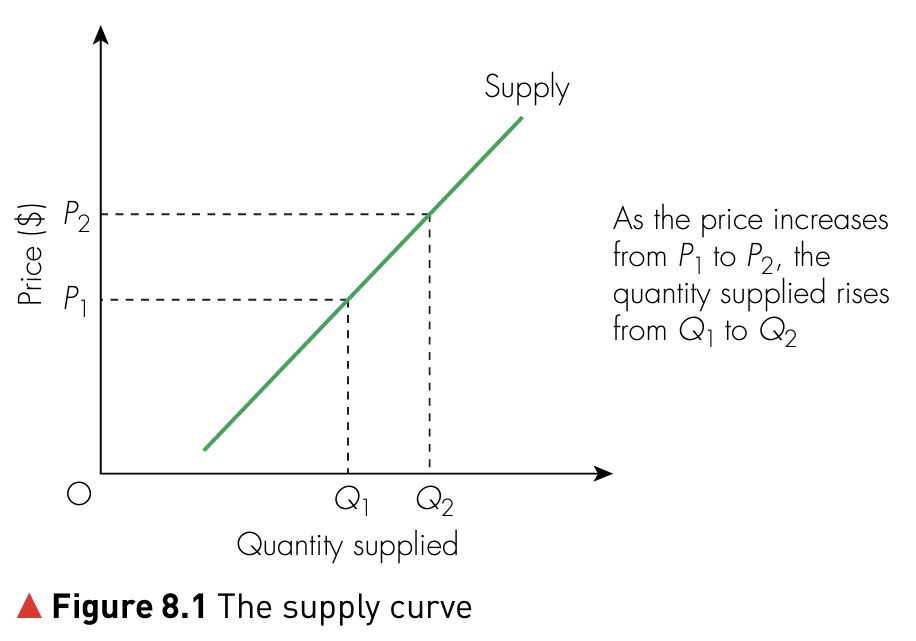
Supply refers to the quantity of a good or service that producers are willing and able to sell at various prices over a period of time. The law of supply states that, ceteris paribus, there is a direct relationship between price and quantity supplied: as the price rises, producers are more willing to supply because higher prices make production more profitable; as the price falls, quantity supplied decreases. This relationship is represented by an upward‑sloping supply curve.
Determinants of supply
Factors other than price that influence supply include:
- Production costs – higher costs (e.g. wages, raw materials) decrease supply; lower costs increase supply.
- Technology – improved technology increases productivity and shifts the supply curve to the right.
- Taxes and subsidies – indirect taxes increase costs and reduce supply, whereas subsidies lower costs and increase supply.
- Number of producers – entry of new firms into a market increases supply.
- Expectations – expectations of future price rises may induce producers to withhold current supply in anticipation of higher prices.
- Opportunity cost – producers reallocate resources toward goods with higher potential profits. If the price of one product falls relative to another, its supply is likely to decrease【542677988308189†L2581-L2588】.
- Weather and natural factors – favourable weather conditions increase agricultural output, whereas natural disasters can reduce supply【542677988308189†L2714-L2723】.
Movements along the supply curve
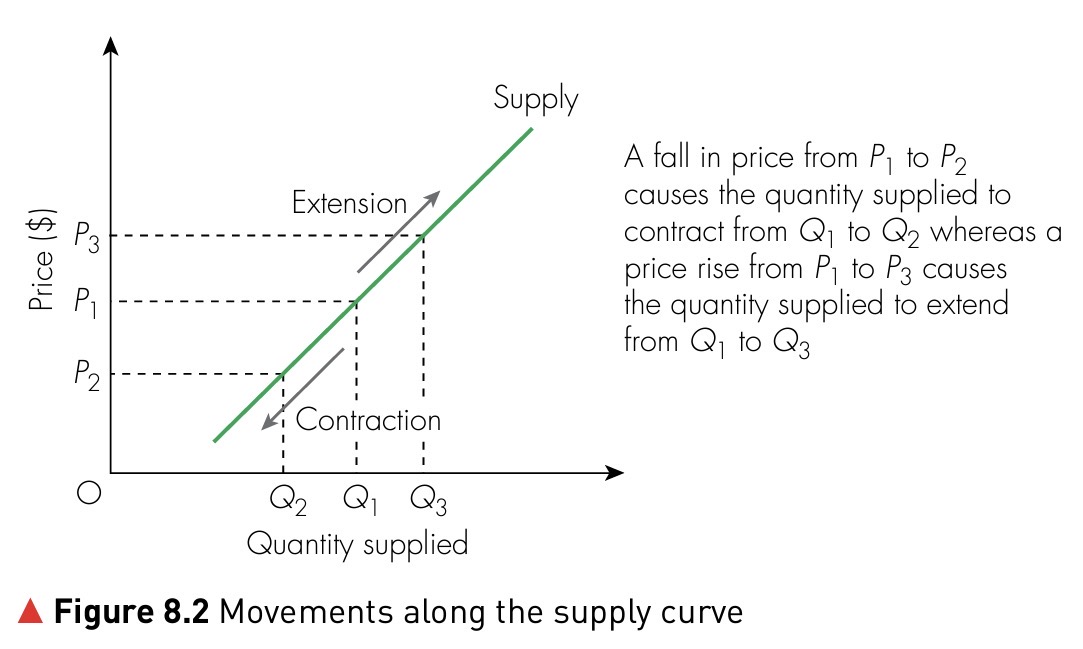
Movements along a supply curve are caused solely by price changes. An increase in price makes supplying the product more profitable, so producers extend supply; a decrease in price results in a contraction of supply because producers supply less when prices fall【542677988308189†L2632-L2637】.
The market supply curve
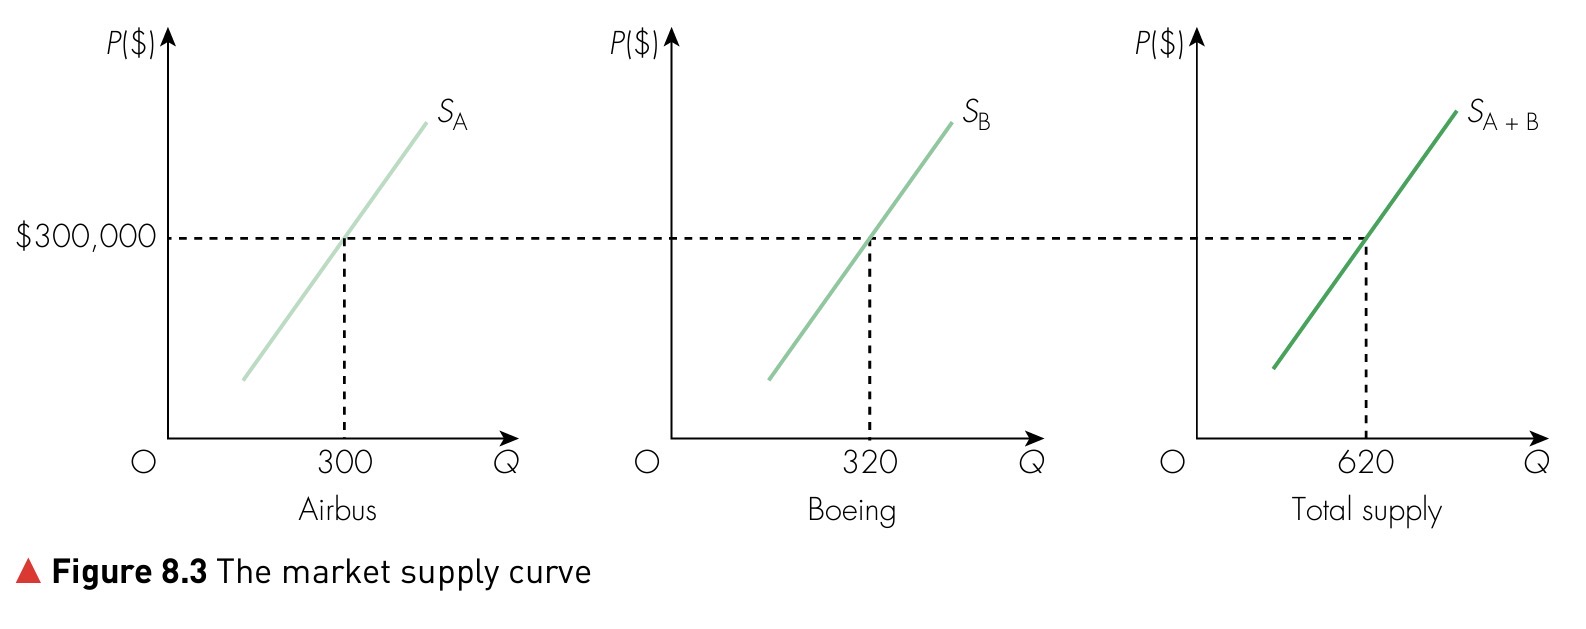
The market supply curve shows the total quantity supplied by all producers at each price. It is derived by horizontally summing individual supply curves – for example, the quantities offered by different firms in an industry【542677988308189†L2683-L2692】.
Shifts in the supply curve (determinants of supply)
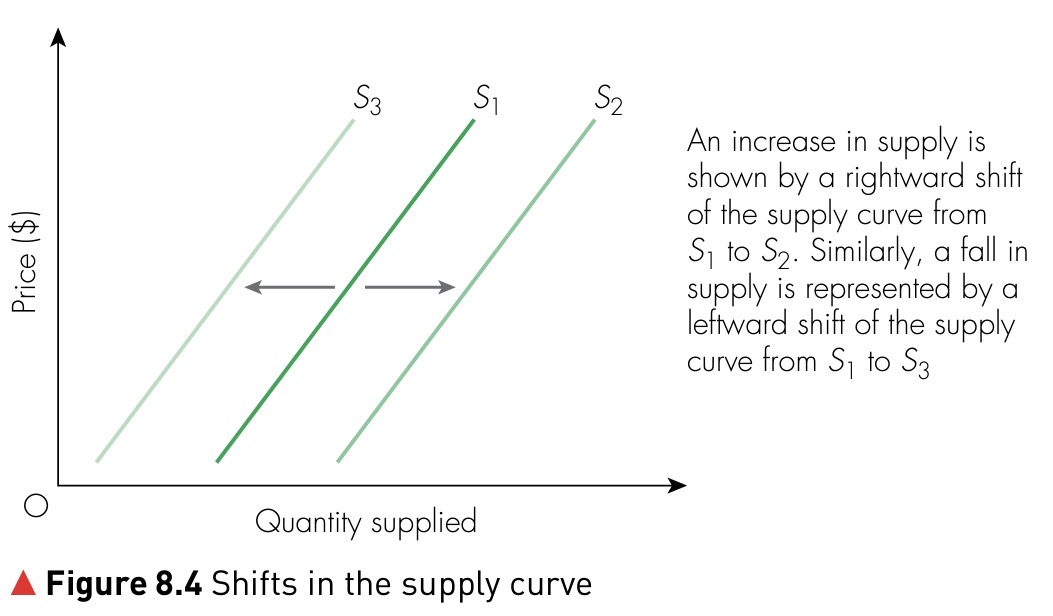
A shift of the supply curve occurs when non‑price determinants of supply change. An increase in supply shifts the curve to the right (producers supply more at every price), while a decrease shifts it to the left【542677988308189†L2714-L2723】. Key determinants include:
- Production costs – lower costs of raw materials or wages allow firms to supply more at each price; higher costs reduce supply【542677988308189†L2588-L2603】.
- Technology and innovations – improved technology (e.g. automation, ICT) increases productivity and shifts supply right【542677988308189†L2593-L2597】.
- Taxes and subsidies – indirect taxes add to production costs and shift supply left; subsidies reduce costs and shift supply right【542677988308189†L2589-L2607】.
- Opportunity cost and profitability – when prices of alternative products change, producers may reallocate resources toward more profitable goods, reducing supply of other products【542677988308189†L2581-L2588】.
- Number of producers – entry of new firms increases total supply in a market.
- Weather and natural factors – favourable weather conditions boost agricultural output; natural disasters can reduce supply significantly【542677988308189†L2714-L2723】.
- Expectations of future prices – if producers expect higher future prices, they may withhold current supply, decreasing current supply.
Together, these factors explain why supply curves shift even if the price of the product itself remains unchanged.