Why prices change in a market
Prices change because the conditions of demand and supply change. In Chapter 9, you learned that the equilibrium price is found where demand and supply meet. In this chapter, the main idea is simple: when demand or supply shifts, the old equilibrium no longer balances the market, so a new price and quantity are formed.
Important rule: A change in price causes movement along a demand or supply curve. A change in another factor, such as tax, weather, income or unemployment, shifts the whole curve.
1. Supply decreases: sales tax
A sales tax increases the cost of production or selling for firms. Because it becomes more expensive to supply the good, firms are willing to supply less at each price. This shifts the supply curve to the left, from S1 to S2.
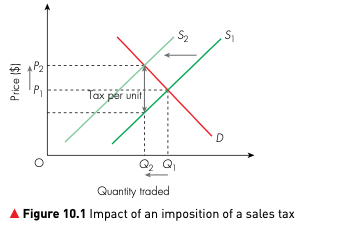
In the diagram, the supply curve shifts left. The new equilibrium has a higher price, from P1 to P2, and a lower quantity traded, from Q1 to Q2. Students often remember this as: tax makes supply more expensive, so price rises and quantity falls.
2. Supply increases: favourable weather
Favourable weather can increase agricultural output. For example, good rainfall and suitable temperatures can improve crop harvests. This means farmers can supply more at each price, so the supply curve shifts to the right, from S1 to S2.
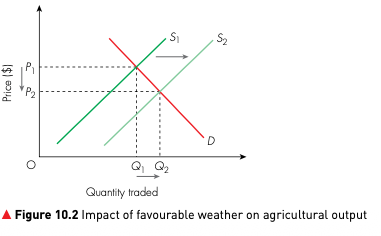
When supply increases, the market has more output available. The new equilibrium price falls from P1 to P2, while quantity traded rises from Q1 to Q2. This is why a very good harvest can sometimes reduce the market price of crops.
Easy supply rule: Supply shifts left = price rises and quantity falls. Supply shifts right = price falls and quantity rises.
3. Demand increases: higher household income
For many goods, higher household income increases demand. These goods are called normal goods. New cars are usually a normal good because people tend to buy more of them when their income rises. This shifts the demand curve to the right, from D1 to D2.
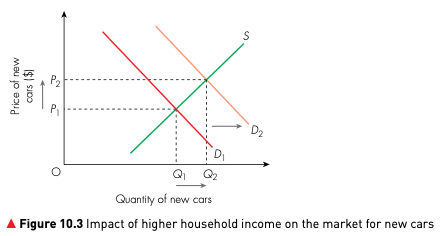
The diagram shows that higher demand increases both the equilibrium price and the equilibrium quantity. Price rises from P1 to P2, and quantity rises from Q1 to Q2. The reason is that more consumers are willing and able to buy new cars at each price.
4. Demand decreases: mass unemployment
Mass unemployment reduces many households’ incomes. When people have less income, they usually spend less on non-essential goods. For example, demand for helium balloons may fall because fewer consumers are willing and able to buy them. This shifts the demand curve to the left, from D1 to D2.
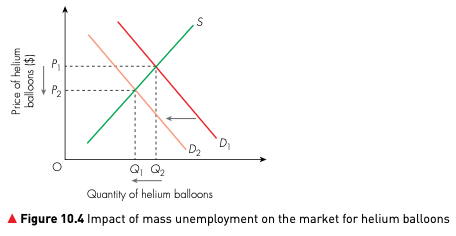
When demand falls, the equilibrium price falls from P1 to P2, and quantity traded falls from Q2 to Q1. This is because fewer buyers want the good, so sellers may need to lower the price to sell their stock.
Easy demand rule: Demand shifts right = price rises and quantity rises. Demand shifts left = price falls and quantity falls.
5. Causes of price changes
Price changes can be caused by many factors. Demand can change because of income, tastes, advertising, population, fashion, the price of substitutes or the price of complements. Supply can change because of production costs, tax, subsidies, technology, weather or the number of firms in the market.
| Change | Curve shift | Effect on price | Effect on quantity |
|---|---|---|---|
| Sales tax increases production cost | Supply shifts left | Rises | Falls |
| Favourable weather increases agricultural output | Supply shifts right | Falls | Rises |
| Higher income increases demand for a normal good | Demand shifts right | Rises | Rises |
| Mass unemployment reduces consumer spending | Demand shifts left | Falls | Falls |
6. How to explain diagrams in exams
For exam answers, use a clear three-step method. First, identify the cause of the change. Second, state whether demand or supply shifts left or right. Third, explain the effect on equilibrium price and quantity. For example: “A sales tax increases firms’ costs, so supply shifts left. This causes price to rise and quantity traded to fall.”
Quick check
- Tax: supply decreases, price rises, quantity falls.
- Good weather: supply increases, price falls, quantity rises.
- Higher income for a normal good: demand increases, price rises, quantity rises.
- Mass unemployment: demand decreases, price falls, quantity falls.