Costs of production
In analysing firm behaviour, it is essential to distinguish different types of cost:
- Fixed costs (FC) – costs that do not vary with output in the short run, such as rent, interest and salaried staff.
- Variable costs (VC) – costs that vary with the level of output, such as raw materials and hourly wages.
- Total cost (TC) – the sum of fixed and variable costs: TC = FC + VC.
- Average cost (AC) – total cost per unit of output: AC = TC / Q.
- Marginal cost (MC) – the change in total cost resulting from producing one more unit: MC = ΔTC / ΔQ.
Revenue
Revenue is the income a firm receives from selling its output:
- Total revenue (TR) – equal to price times quantity sold: TR = P × Q.
- Average revenue (AR) – revenue per unit sold: AR = TR / Q. In a competitive market AR is equal to price.
- Marginal revenue (MR) – the change in total revenue when one extra unit is sold: MR = ΔTR / ΔQ.
Summary of cost and revenue formulas
| Concept | Formula |
|---|---|
| Total cost (TC) | FC + VC |
| Average cost (AC) | TC / Q |
| Marginal cost (MC) | ΔTC / ΔQ |
| Total revenue (TR) | P × Q |
| Average revenue (AR) | TR / Q |
| Marginal revenue (MR) | ΔTR / ΔQ |
Profit and objectives
Profit is calculated as the difference between total revenue and total cost (π = TR − TC). The traditional theory of the firm suggests that firms maximise profit by producing the output level where marginal cost equals marginal revenue. However, firms may pursue other objectives, including:
- Revenue maximisation – aiming to increase sales to build market share, sometimes at the expense of short‑term profits.
- Growth maximisation – to exploit economies of scale, deter competitors and satisfy managerial ambition.
- Survival – especially for new or small firms during economic downturns.
- Social and ethical goals – such as reducing carbon emissions or supporting community initiatives.
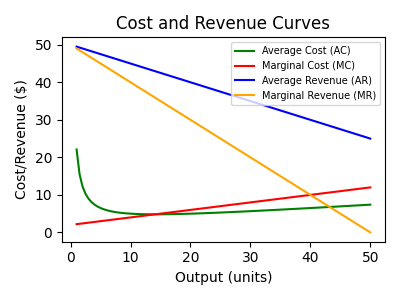
Cost and revenue curves
The relationship between cost and revenue can be illustrated using curves. In the diagram below, average cost (AC) typically has a U‑shape because of economies and diseconomies of scale, while marginal cost (MC) cuts the AC curve at its minimum point. Average revenue (AR) is the demand curve faced by the firm, and marginal revenue (MR) lies below AR for firms with some market power.
Examples and applications
Imagine a small coffee shop. The monthly rent for the premises and the salaries of two full‑time baristas are fixed costs – they do not change whether the shop sells 50 or 500 cups of coffee. Coffee beans, milk and cups are variable costs – the more drinks sold, the more supplies are needed. If the shop sells 1 000 cups of coffee at $3 each in a month, total revenue (TR) is $3 000. If total costs (TC) amount to $2 400, profit (π) is $600. The owner can use cost and revenue concepts to decide whether to introduce new products or increase prices.
Larger firms such as airlines use cost curves to determine the most efficient scale of operation. For example, low‑cost carriers aim to keep their average costs low by operating at high load factors. They may expand routes or buy larger aircraft to spread fixed costs over more passengers, but must balance this against the risk of empty seats increasing average costs.