Calculation and Understanding of Accounting Ratios
These notes explain how accounting ratios are calculated and what each ratio helps users understand. The chapter focuses on profitability, liquidity and efficiency, with worked examples and exam reminders.
Topic 1: What Accounting Ratios Show
Ratios compare figures in financial statements so users can judge performance more clearly.
1. What are Accounting Ratios?
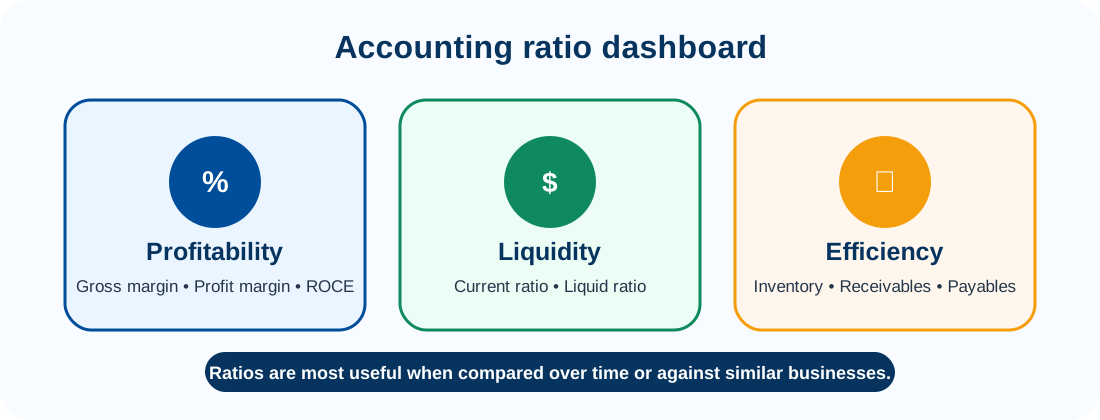
Accounting ratios are used to analyse the relationships between figures in financial statements.
Profitability
How well the business earns profit.
Liquidity
Ability to pay short-term debts.
Efficiency
How well resources are being managed.
Ratios are more useful when compared with previous years, similar businesses and industry averages.
| Main ratios in this chapter | Area |
|---|---|
| Gross margin | Profitability |
| Profit margin | Profitability |
| Return on capital employed (ROCE) | Profitability / efficiency of capital |
| Current ratio | Liquidity |
| Liquid (acid test) ratio | Liquidity |
| Rate of inventory turnover | Efficiency |
| Trade receivables turnover | Efficiency |
| Trade payables turnover | Efficiency |
Topic 2: Profitability Ratios
Profitability ratios show how much profit is earned from sales and how efficiently capital is used.
2. Gross Margin
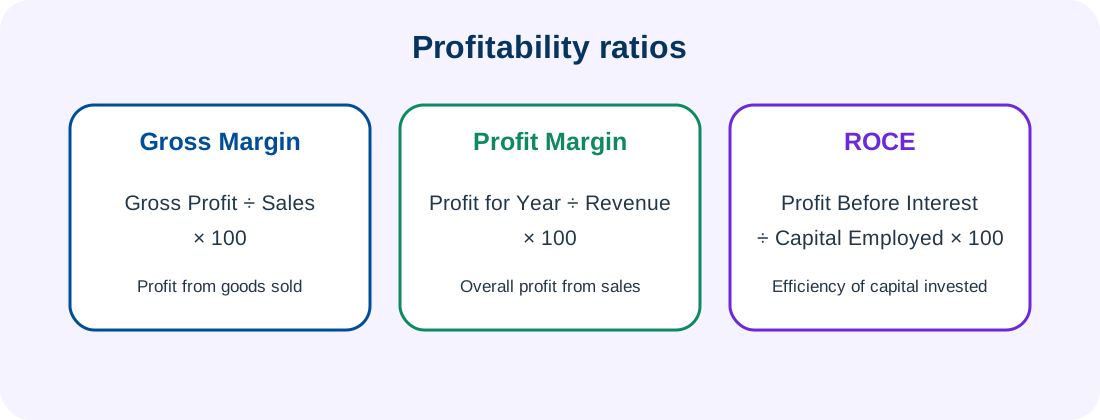
The gross margin measures the gross profit earned from sales.
Sales revenue = $80,000
Gross profit = $24,000
Gross margin = $24,000 ÷ $80,000 × 100 = 30%
This means that for every $100 of sales, the business earns $30 gross profit.
3. Why Might Gross Margin Fall?
- Selling prices have been reduced.
- More trade discount has been offered.
- Cost of goods has increased without increasing selling prices.
Last year: sales = $100,000, gross profit = $40,000, gross margin = 40%.
This year: sales = $120,000, gross profit = $36,000, gross margin = 30%.
Even though sales increased, the business is making less gross profit from every $100 of sales.
4. How Can Gross Margin Be Improved?
- Increase selling prices.
- Find cheaper suppliers.
- Reduce cost of sales.
- Sell more profitable products.
- Change the product range.
5. Profit Margin
The profit margin measures the profit for the year earned from sales.
Sales revenue = $80,000
Profit for the year = $12,000
Profit margin = $12,000 ÷ $80,000 × 100 = 15%
This means the business makes $15 profit for every $100 of sales.
6. Gross Margin vs Profit Margin
| Ratio | Uses |
|---|---|
| Gross margin | Gross profit |
| Profit margin | Profit for the year |
Gross margin = 30%
Profit margin = 15%
Difference = 30% − 15% = 15%
7. Return on Capital Employed – ROCE
Return on capital employed (ROCE) measures how efficiently the business uses the money invested in it.
8. What is Capital Employed?
The chapter gives two main ways of calculating capital employed:
Method 1
Capital Employed = Owner’s Equity + Non-Current Liabilities
Method 2
Capital Employed = Non-Current Assets + Current Assets − Current Liabilities
Owner’s equity = $60,000
Long-term loan = $20,000
Capital employed = $60,000 + $20,000 = $80,000
If profit before interest = $12,000, ROCE = $12,000 ÷ $80,000 × 100 = 15%
9. Average Capital Employed
Sometimes the question may require average capital employed.
Topic 3: Liquidity Ratios
Liquidity ratios show whether the business can pay its current liabilities.
10. Working Capital
Working capital is the amount available for the day-to-day running of the business.
Current assets = $25,000
Current liabilities = $10,000
Working capital = $25,000 − $10,000 = $15,000
11. Current Ratio
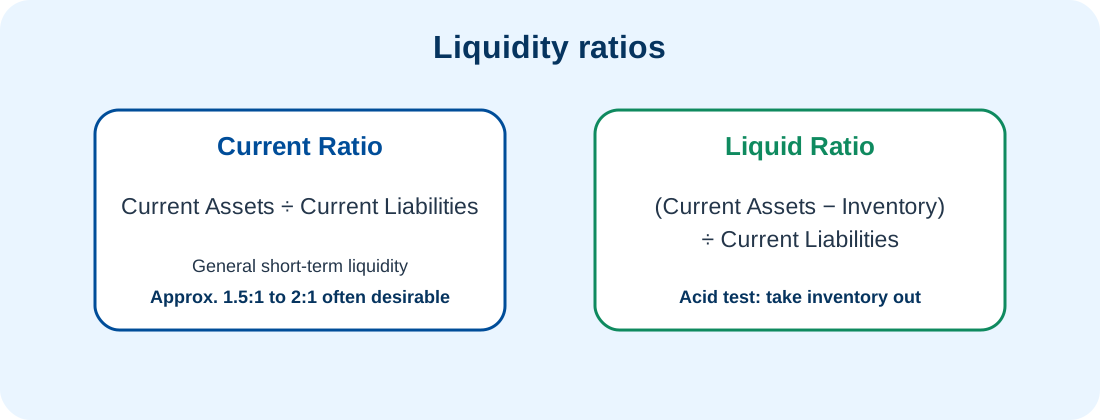
The current ratio, also called the working capital ratio, measures the business’s ability to pay its current liabilities from its current assets.
Current assets = $30,000
Current liabilities = $15,000
Current ratio = $30,000 ÷ $15,000 = 2 : 1
This means the business has $2 of current assets for every $1 of current liabilities.
12. What is a Good Current Ratio?
The textbook states that a current ratio between approximately 1.5 : 1 and 2 : 1 is normally considered desirable.
13. Improving the Current Ratio
- Reduce drawings.
- Introduce more capital.
- Obtain additional long-term finance.
- Sell unnecessary non-current assets.
14. Liquid (Acid Test) Ratio
The liquid ratio, also called the acid test ratio, provides a stricter test of liquidity. Inventory is excluded because it is the least liquid current asset.
Current assets = $30,000
Inventory = $12,000
Current liabilities = $15,000
Liquid ratio = ($30,000 − $12,000) ÷ $15,000 = 1.2 : 1
15. What is a Good Liquid Ratio?
The textbook gives 1 : 1 as a generally desirable liquid ratio, although comparisons should again consider the industry and type of business.
Too low
A ratio much lower than 1 : 1 may indicate difficulty paying current liabilities.
Too high
A very high ratio may mean too much money is tied up in cash, bank balances and trade receivables. This money might be used more productively elsewhere.
16. Current Ratio vs Liquid Ratio
| Current Ratio | Liquid Ratio |
|---|---|
| Includes inventory. | Excludes inventory. |
| Measures general short-term liquidity. | Stricter measure of liquidity. |
| Approximately 1.5–2 : 1 often desirable. | Approximately 1 : 1 often desirable. |
Topic 4: Efficiency Ratios
Efficiency ratios show how effectively inventory, receivables and payables are being managed.
17. Rate of Inventory Turnover
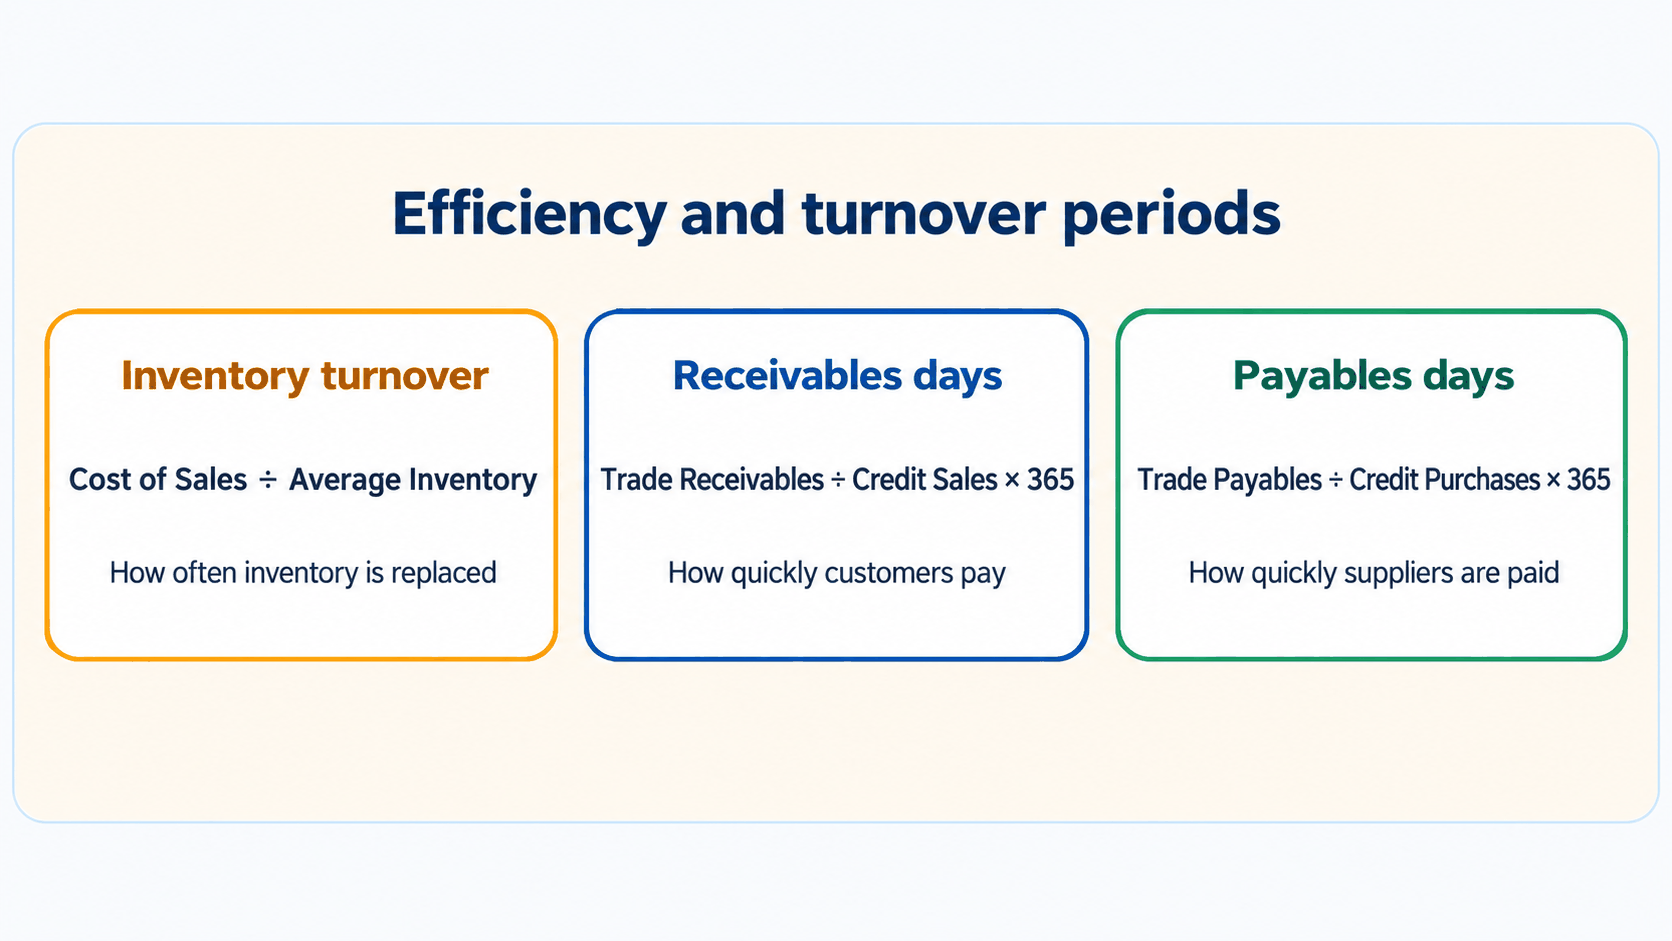
The rate of inventory turnover measures how many times inventory is sold and replaced during the year.
18. Inventory Turnover Example
Opening inventory = $6,000
Closing inventory = $4,000
Average inventory = ($6,000 + $4,000) ÷ 2 = $5,000
Inventory turnover = $45,000 ÷ $5,000 = 9 times
This means the business sells and replaces its average inventory approximately 9 times during the year.
19. Inventory Turnover in Days
$5,000 ÷ $45,000 × 365 ≈ 41 days
This means inventory is held for an average of approximately 41 days before being sold.
20. High vs Low Inventory Turnover
High turnover may indicate
- Goods sell quickly.
- Inventory is well managed.
- Less money is tied up in stock.
- Goods are less likely to become outdated.
Low turnover may indicate
- Too much inventory.
- Slow sales.
- Falling demand.
- Uncompetitive prices.
- Poor sales promotion.
- Old or obsolete inventory.
- Money unnecessarily tied up in inventory.
21. Trade Receivables Turnover
The trade receivables turnover measures how long credit customers take, on average, to pay the business.
22. Trade Receivables Example
Credit sales = $100,000
Receivables turnover = $20,000 ÷ $100,000 × 365 = 73 days
Customers take approximately 73 days to pay.
23. Why is Receivables Turnover Important?
Generally, a shorter collection period is better because cash is received faster, liquidity improves, the business can pay its own debts, and the risk of irrecoverable debts falls.
A long collection period may indicate weak credit control. However, a business may deliberately offer longer credit periods to attract customers.
24. Improving Trade Receivables Turnover
- Offer cash discounts for prompt payment.
- Charge interest on overdue debts.
- Use better credit control.
- Chase overdue customers.
- Refuse further credit to customers with outstanding debts.
Credit terms allowed = 40 days
Actual collection period = 30 days
This is generally good because customers are paying before the allowed credit period ends.
25. Trade Payables Turnover
The trade payables turnover measures how long the business takes, on average, to pay its credit suppliers.
26. Trade Payables Example
Credit purchases = $50,000
Payables turnover = $5,000 ÷ $50,000 × 365 = 36.5 days
Rounded to approximately 37 days.
27. Why is Payables Turnover Important?
A business should normally make good use of the credit period offered by suppliers without damaging its relationship with them. If credit terms are 40 days and the business pays in 37 days, it is making effective use of the credit period.
A rising payables period may indicate liquidity problems or inefficient payment of suppliers.
28. Problems with Paying Suppliers Too Late
Delaying payment can provide temporary interest-free finance, but it may cause:
- Loss of cash discounts.
- Supplier refusing further sales.
- Supplier refusing future credit.
- Damage to supplier relationships.
Topic 5: Quick Formula and Meaning Guide
Use this final section for fast exam revision.
29. Quick Formula Guide
| Ratio | Formula |
|---|---|
| Gross margin | Gross profit ÷ Sales × 100 |
| Profit margin | Profit for year ÷ Revenue × 100 |
| ROCE | Profit before interest ÷ Capital employed × 100 |
| Working capital | Current assets − Current liabilities |
| Current ratio | Current assets ÷ Current liabilities |
| Liquid ratio | (Current assets − Inventory) ÷ Current liabilities |
| Average inventory | (Opening inventory + Closing inventory) ÷ 2 |
| Inventory turnover | Cost of sales ÷ Average inventory |
| Inventory turnover days | Average inventory ÷ Cost of sales × 365 |
| Receivables turnover | Trade receivables ÷ Credit sales × 365 |
| Payables turnover | Trade payables ÷ Credit purchases × 365 |
30. What Does Each Ratio Measure?
| Ratio | Measures |
|---|---|
| Gross margin | Profitability of goods sold |
| Profit margin | Overall profitability of sales |
| ROCE | Efficiency of capital employed |
| Current ratio | Short-term liquidity |
| Liquid ratio | Immediate liquidity excluding inventory |
| Inventory turnover | Efficiency of inventory management |
| Receivables turnover | Speed customers pay |
| Payables turnover | Speed business pays suppliers |
Remember
Gross Margin = Gross Profit ÷ Sales × 100
Profit Margin = Profit for Year ÷ Revenue × 100
ROCE = Profit Before Interest ÷ Capital Employed × 100
Current Ratio = Current Assets ÷ Current Liabilities
Liquid Ratio = (Current Assets − Inventory) ÷ Current Liabilities
Inventory Turnover = Cost of Sales ÷ Average Inventory
Trade Receivables Days = Trade Receivables ÷ Credit Sales × 365
Trade Payables Days = Trade Payables ÷ Credit Purchases × 365