7.7 Trace tables to document dry runs of algorithms
A trace table records what happens to variables and outputs as an algorithm is followed step by step. This manual step-by-step process is called a dry run and is carried out using chosen test data.
Trace tables and dry runs
A trace table is used to record the results from each step of an algorithm. It records the value of a variable each time that value changes. A dry run is the manual process of working through the algorithm one step at a time.
Trace tables can be used with algorithms shown as either flowcharts or pseudocode. Suitable test data is supplied, and the algorithm is followed exactly in the order shown.
What to record
| When this happens | What goes in the trace table |
|---|---|
| A variable changes value | Write the new value in that variable's column. |
| The algorithm outputs a value | Write that value in the OUTPUT column. |
| A variable does not change | No new value needs to be entered for that variable on that step. |
Worked example: tracing a flowchart
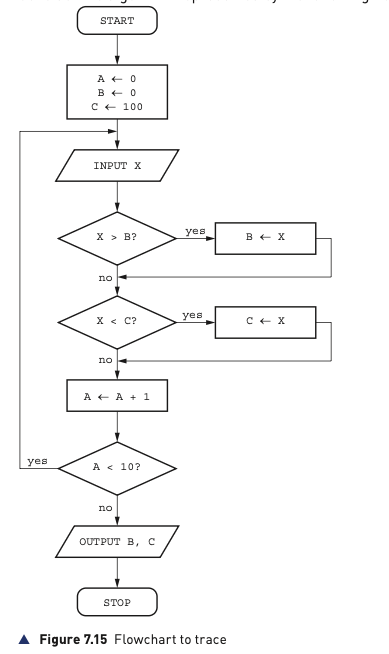
The textbook example uses the following algorithm. It starts with A ← 0, B ← 0 and C ← 100. Each value is input into X. The algorithm compares X with B and C, updates B or C when required, increments A, and repeats until ten values have been processed.
Test data
The test data used for the worked dry run is:
9, 7, 3, 12, 6, 4, 15, 2, 8, 5The starting row of the trace table contains the initial values A = 0, B = 0 and C = 100. As each input is processed, only changed values are entered in the relevant columns.
| A | B | C | X | OUTPUT |
|---|---|---|---|---|
| 0 | 0 | 100 | ||
| 1 | 9 | 9 | 9 | |
| 2 | 7 | 7 | ||
| 3 | 3 | 3 | ||
| 4 | 12 | 12 | ||
| 5 | 6 | |||
| 6 | 4 | |||
| 7 | 15 | 15 | ||
| 8 | 2 | 2 | ||
| 9 | 8 | |||
| 10 | 5 | |||
| 15 2 |
Understanding the dry run
For the first input, X is 9. Since 9 is greater than B (0), B changes to 9. Since 9 is also less than C (100), C changes to 9. A is then increased to 1.
For the next input, X is 7. It is not greater than B, so B stays 9. It is less than C, so C changes to 7. This continues for all ten values.
After the ten values have been processed, the output is 15 and 2. From this output, the purpose of the algorithm can be identified: it finds the largest and smallest values from a list of ten positive numbers.
Tracing the same algorithm as pseudocode
The same process can be represented in pseudocode. A trace table can still be used in exactly the same way: follow each statement in order, record every changed variable value, and record each output when it occurs.
A ← 0
B ← 0
C ← 100
OUTPUT "Enter your ten values"
REPEAT
  INPUT X
  IF X > B
    THEN
      B ← X
  ENDIF
  IF X < C
    THEN
      C ← X
  ENDIF
  A ← A + 1
UNTIL A = 10
OUTPUT B, C
When dry-running this pseudocode, the prompt Enter your ten values is the first output. The quotation marks are not written in the OUTPUT column because they are only used in pseudocode to mark the text string.