Worked example · Easy
Fair die
A fair six-sided die is rolled. Find the probability of a multiple of 3.
Multiples of 3 are 3 and 6, giving two favourable outcomes from six.
\[P(\text{multiple of 3})=\frac26=\boxed{\frac13}\]Learn to calculate, interpret and estimate probabilities using outcomes, sample spaces, Venn diagrams and probability trees.
Subtopic 1
Probability describes how likely an event is to occur. Its value is between 0 (impossible) and 1 (certain). A probability of \(\tfrac12\) means an even chance. Fractions, decimals and percentages are equivalent ways to describe a chance.
A random experiment has possible outcomes. An event is the outcome or group of outcomes you are interested in. Count favourable outcomes only when all individual outcomes are equally likely.
For unequal chances (a biased spinner), use the actual given probabilities instead of assuming equal likelihood. Simplify a fractional answer.
A fair six-sided die is rolled. Find the probability of a multiple of 3.
Multiples of 3 are 3 and 6, giving two favourable outcomes from six.
\[P(\text{multiple of 3})=\frac26=\boxed{\frac13}\]A bag has 5 red, 3 blue and 2 yellow counters. Find the probabilities of red and of blue or yellow.
Total counters: \(5+3+2=10\).
\[P(R)=\frac5{10}=\boxed{\tfrac12}\]\[P(B\text{ or }Y)=\frac{3+2}{10}=\boxed{\tfrac12}\]Of 30 students, 8 boys and 12 girls study art, while 5 boys and 5 girls study music. One student is chosen at random. Find (a) the probability of an art student, (b) the probability of a girl who studies music, and (c) the probability of a girl.
Totals: art \(8+12=20\); music \(5+5=10\); girls \(12+5=17\).
\[\text{(a) }\frac{20}{30}=\boxed{\tfrac23}\quad\text{(b) }\frac5{30}=\boxed{\tfrac16}\quad\text{(c) }\frac{17}{30}\]Subtopic 2
The complement of event \(A\) is the event that \(A\) does not happen. If one of several possible outcomes has an unknown probability, subtract the total of the other probabilities from 1.
For a complete set of mutually exclusive outcomes, all their probabilities add up to 1. You may see the complement written \(A'\), \(A^c\) or “not A”.
For a complete list of separate outcomes: \(P(A_1)+P(A_2)+\cdots=1\).

The chance of rain tomorrow is \(\tfrac3{10}\). Find the chance of no rain.
A spinner has outcomes A, B, C and D, with probabilities 0.23, 0.18, 0.37 and \(p\). Find \(p\).
A team has probability 0.35 of a win and 0.25 of a draw. Find (a) the probability of a loss and (b) the probability that the team does not lose.
Part (b) also equals \(P(\text{win})+P(\text{draw})\).
Subtopic 3
A probability can be used to estimate the expected number of occurrences in many trials or a whole population. This is called the expected frequency. An expectation is not a guarantee: actual results vary.
You can use a probability stated as a fraction, decimal or percentage, but convert it to a number between 0 and 1 before multiplying.
To estimate how many people or items fall into a category, multiply the population total by the appropriate estimated probability.
A fair die is rolled 180 times. Estimate the number of sixes.
42 of 140 people surveyed prefer cycling. Estimate how many of 900 people would prefer cycling if the survey is representative.
A factory has a 1.5% probability of producing a faulty component. Estimate (a) how many faulty components occur in 800, and (b) how many are not faulty.
Subtopic 4
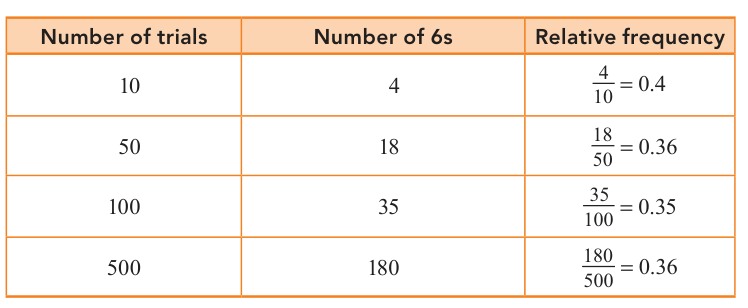
When events are not known to be equally likely (for example a drawing pin landing point up), use observations. Relative frequency is the proportion of trials in which the event occurred and provides an experimental estimate of probability.
The estimate may change from sample to sample. Results from larger, representative samples are generally more stable. Comparing observed frequencies with equal chances can suggest whether a spinner is biased.
To predict future counts from an experiment, multiply this estimated probability by the number of future trials.

A drawing pin points upwards on 75 of 200 throws. Estimate the probability of point up.
A biased spinner shows red 18 times in 60 trials and 142 times in 500 more trials. Estimate the probability of red using all the data.
Combine both sets of results before dividing.
\[\frac{18+142}{60+500}=\frac{160}{560}=\boxed{\frac27\approx0.286}\]In a survey of 300 students, 90 travel by bus. Estimate (a) the probability a randomly chosen student travels by bus, and (b) the number travelling by bus in a school of 1200, assuming the sample is representative.
Subtopic 5
For two experiments, list every possible outcome in a sample space diagram. Rows and columns can represent the first and second spinners, dice or coins; each table cell is one outcome.
Events are mutually exclusive if they cannot both occur in a single trial. If they overlap, adding their probabilities directly would count the overlap twice. A Venn diagram helps identify the intersection and union of events.
\(A\cap B\) means both conditions are met; \(A\cup B\) means at least one. In a sample space with equally likely cells, count the favourable cells.
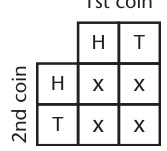
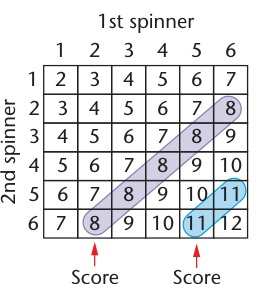
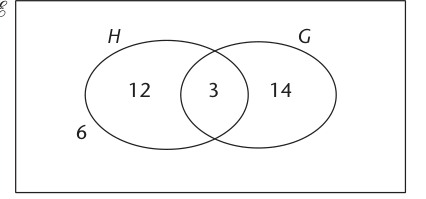
Two fair coins are tossed. Find the probability of getting exactly one head.
Sample space: HH, HT, TH, TT. Exactly one head occurs in HT or TH.
\[P(\text{one head})=\frac24=\boxed{\tfrac12}\]Two fair six-sided dice are rolled. What is the probability that their total is 7?
There are \(6\times6=36\) equally likely ordered pairs. The favourable pairs are (1,6), (2,5), (3,4), (4,3), (5,2), (6,1).
\[P(\text{total }7)=\frac6{36}=\boxed{\tfrac16}\]In a class of 29 students, 14 play football, 12 play tennis and 5 play both. One student is selected at random. Find the probability they (a) play at least one sport and (b) play neither.
Subtopic 6
Two events are independent when knowing the result of one does not change the probability of the other. Examples are separate coin tosses and selecting a ball with replacement, returning it before the second selection.
The word and often signals multiplying along a sequence. For more than two independent events, multiply all their probabilities. For events joined by or, first decide which distinct outcomes are being combined.
Use this only if independence is justified. “With replacement” keeps the same proportions after each draw.
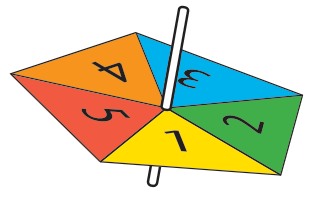
A fair coin is tossed and a fair die rolled. Find the probability of a head and a 4.
A bag has 3 green and 2 black counters. A counter is chosen, replaced and then another chosen. Find the probability of green followed by black.
A machine independently makes faulty items with probability 0.04. Three items are tested. Calculate the probability that at least one is faulty.
The complement of “at least one faulty” is “none faulty”.
\[P(\text{none})=(1-0.04)^3=0.96^3=0.884736\]\[P(\text{at least one})=1-0.884736=\boxed{0.115264}\]Subtopic 7
A probability tree records possible routes through successive experiments. Each branch is labelled with a probability. The probabilities leaving any one node must add to 1.
To find the probability of a particular route, multiply probabilities along its branches. If several routes satisfy the question, add their route probabilities. This works with two or more stages.
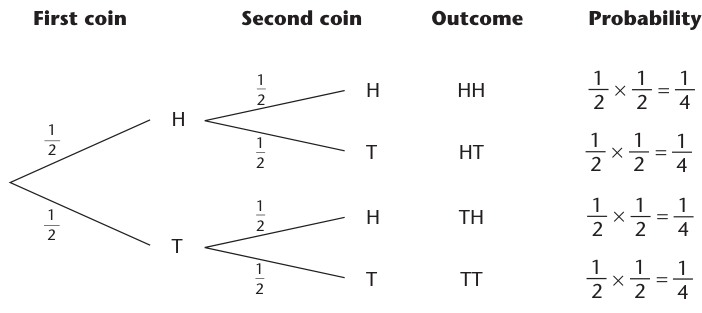
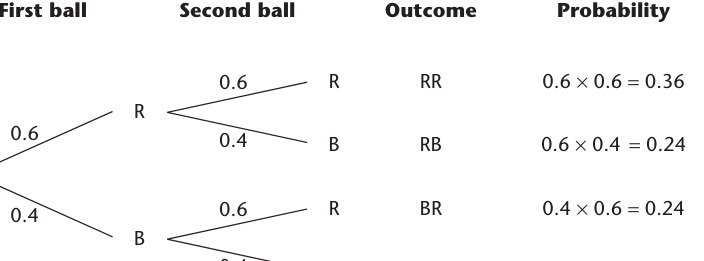
Two fair coins are tossed. Use the branches to find the probability of exactly one head.
A bag contains 4 red and 2 blue counters. Two counters are chosen with replacement. Find the probability that both have the same colour.
A team independently wins any game with probability 0.7. Use a two-stage tree to calculate the probability of winning exactly one of two games.
Subtopic 8
Events are dependent if what happens first changes the probabilities later. Selecting objects without replacement is the central example: one object leaves the collection, reducing the total, and perhaps the number of favourable objects as well.
In the probability tree, the second-stage branches must be calculated separately for each first-stage outcome. For a conditional question, use the information about the first outcome to select the appropriate branches.
If the first draw removes an item, the new total is one smaller. For a particular path, multiply the first probability by the probability of the second outcome given the first.
\[\boxed{P(A\text{ then }B)=P(A)\times P(B\mid A)}\]\(P(B\mid A)\) is the probability of B after A has occurred. Add the paths only after calculating the branch probabilities correctly.
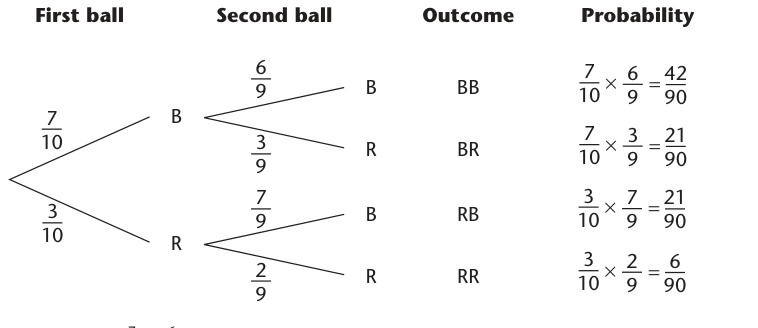
There are 3 red and 2 blue counters. Two are chosen without replacement. Find the probability that both are red.
After the first red is taken, 2 red remain from 4 counters.
A bag contains 5 red and 3 blue counters. Two are drawn without replacement. Find the probability that they have the same colour.
The probability of rain is 0.3. If it rains, the chance of a bus delay is 0.6; if it does not rain, the chance of delay is 0.1. Find (a) the overall probability of delay and (b) the probability that it does not rain and the bus is on time.
Separate the rainy and dry routes:
\[P(\text{delay})=0.3(0.6)+0.7(0.1)=\boxed{0.25}\]\[P(\text{dry and on time})=0.7(0.9)=\boxed{0.63}\]Independent practice
40 original practice questions begin with straightforward probability, progress to interpretation and calculations, and finish with multi-step exam-style questions. Attempt each question before opening its Show Answer section.
A fair die is rolled. Find the probability of an odd number.
The probability that a student catches a bus is 0.28. Find the probability that they miss it.
A fair four-section spinner is spun 80 times. How often would you expect it to show section 1?
A player wins 18 out of 90 games. Estimate the probability that the player wins the next game.
Two fair coins are tossed. What is the probability of getting two tails?
Possible outcomes: HH, HT, TH, TT.
\[P(TT)=\boxed{\frac14}\]A fair coin is tossed twice. Calculate the probability of heads both times using multiplication.
A fair spinner has two equal sectors, A and B. It is spun twice. Find the probability of getting exactly one A.
The two successful routes are AB and BA.
\[\frac14+\frac14=\boxed{\frac12}\]A bag holds 4 green and 2 yellow balls. Two are drawn without replacement. Find the probability both are green.
A bag contains 8 red, 4 yellow and 3 black balls. Find the probability of not selecting black.
There are 15 balls. The 12 red or yellow balls are not black.
\[P(\text{not black})=\frac{12}{15}=\boxed{\frac45}\]One letter is chosen at random from PROBABILITY. Find the probability of selecting B.
There are 11 letters and B appears twice.
\[P(B)=\boxed{\frac2{11}}\]A spinner has four outcomes with probabilities 0.14, 0.26, 0.37 and \(p\). Find \(p\).
The probability of winning a match is 0.40 and drawing it is 0.15. Calculate the probability of losing.
Each item has probability 0.35 of passing a quality check. Estimate how many of 240 items pass.
Three in every 100 manufactured parts are expected to be faulty. Estimate the number of faulty parts in a batch of 600.
A spinner shows blue 27 times in 150 spins. Estimate the probability of blue.
A bus is late on 60 of 250 observed journeys. Estimate how many delays occur in the next 500 journeys.
Two fair dice are rolled. Find the probability that the total is 9.
Successful ordered pairs: (3,6), (4,5), (5,4), (6,3), out of 36.
\[P(9)=\frac4{36}=\boxed{\frac19}\]In a group of 28, 13 study music, 10 study drama and 4 study both. What is the probability that a randomly chosen member studies neither?
Calculate the probability that a fair die shows an odd number and a fair coin shows tails.
A spinner shows red with probability 0.6. Find the probability of red on all three independent spins.
A bag contains 2 red and 3 blue balls. Two are selected with replacement. Find the probability of the same colour twice.
A player independently succeeds on each attempt with probability 0.8. Find the probability of exactly one failure in two attempts.
A bag has 6 red and 4 blue balls. Two are drawn without replacement. Find the probability of red then blue.
There are 7 green and 3 blue balls. One blue ball is taken and not replaced. What is the probability the next ball is green?
There are still 7 green, but only 9 balls remain.
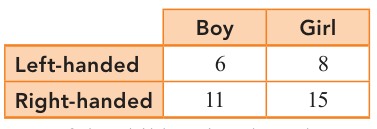
\[P(G\mid\text{first blue})=\boxed{\frac79}\]A class of 42 pupils contains 12 left-handed boys, 9 left-handed girls, 8 right-handed boys and 13 right-handed girls. One student is selected at random. Calculate (a) the probability of a left-handed student, (b) of a right-handed girl, and (c) of a boy.
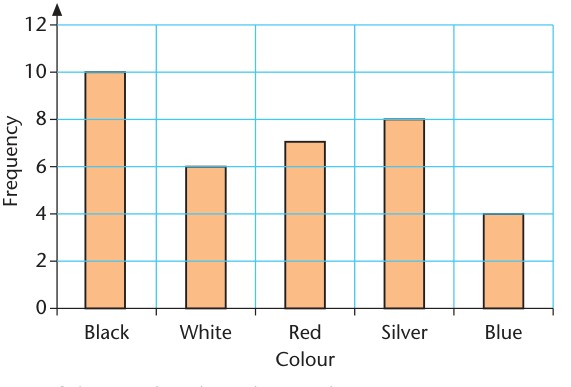
The Chapter 44 car-colour bar chart shows 10 black, 6 white, 7 red, 8 silver and 4 blue cars. If a car is selected at random, find the probability that it is red or blue and explain your denominator.
There are \(10+6+7+8+4=35\) cars. Red and blue are separate possible colours.
\[P(R\text{ or }B)=\frac{7+4}{35}=\boxed{\frac{11}{35}}\]A bag contains red, blue and green counters. The probability of red is \(\tfrac15\) and the probability of blue is \(\tfrac3{10}\). Find (a) the probability of green and (b) the probability of not selecting blue.
On a journey the probabilities of arriving early and on time are 0.18 and 0.57, respectively. The other possibility is arriving late. Find (a) the probability of late arrival and (b) the probability of not arriving early.
A survey estimates that \(\tfrac3{14}\) of students cycle to school. There are 420 students. Estimate (a) the number who cycle and (b) the number who do not cycle. Explain why your prediction need not be exact.
These are estimates based on a probability, so actual observed counts may differ.
The probability that a product is faulty is 0.025. A company makes 1200 products. Estimate how many are (a) faulty and (b) not faulty, showing your workings.
In 400 spins a spinner lands on red 96 times. Use the results to estimate (a) the probability of red, (b) the probability of not red and (c) the number of reds expected in the next 750 spins.
A factory inspects 50 components and finds 20 faulty. Later it inspects a further 250 and finds 82 faulty. Estimate (a) the overall faulty probability and (b) the faulty count in the next 200 components.
Combine both samples:
\[P(\text{faulty})\approx\frac{20+82}{50+250}=\frac{102}{300}=\boxed{0.34}\]\[200\times0.34=\boxed{68}\]Two fair dice are rolled. Find the probability that the sum is greater than 9, showing all the successful totals and their frequencies.
Sum 10: 3 pairs; sum 11: 2 pairs; sum 12: 1 pair. In all, 6 favourable outcomes out of 36.
\[P(\text{total}>9)=\frac6{36}=\boxed{\frac16}\]In a group of 40 pupils, 19 take music, 17 take drama and 8 take both. (a) How many take at least one? (b) Find the probability a randomly chosen pupil takes neither.
On any day a bus is late with probability 0.1. Assume days are independent. Over three days find (a) the probability it is never late and (b) the probability it is late at least once.
A bag contains 7 white and 3 black balls. A ball is selected, replaced and then another ball is selected. Calculate the probability of exactly one black ball.
Draw or use a tree diagram for three fair coin tosses. Find the probability of exactly two heads, naming the possible routes.
Routes: HHT, HTH and THH. Each has probability \(\tfrac12\cdot\tfrac12\cdot\tfrac12=\tfrac18\).
\[P(\text{exactly two heads})=3\times\frac18=\boxed{\frac38}\]A biased coin shows heads with probability 0.3 on each independent toss. Use a tree or a complement to find the probability of at least one head in two tosses.
The complement is two tails, each with probability 0.7.
\[P(\text{at least one H})=1-(0.7\times0.7)=\boxed{0.51}\]A bag contains 5 green, 3 yellow and 2 red counters. Two counters are drawn without replacement. Calculate the probability that exactly one is green and one is yellow.
Both orders count: GY and YG.
\[\frac5{10}\cdot\frac39+\frac3{10}\cdot\frac59=\frac{30}{90}=\boxed{\frac13}\]A pupil walks to school with probability 0.4, cycles with probability 0.3 and takes a bus otherwise. The probabilities of being late are 0.1 when walking, 0.2 when cycling and 0.5 when on a bus. Find the probability of being on time.
The bus probability is \(1-0.4-0.3=0.3\). Sum the separate late routes:
\[P(L)=0.4(0.1)+0.3(0.2)+0.3(0.5)=0.25\]\[P(\text{on time})=1-0.25=\boxed{0.75}\]I know probability ranges from 0 (impossible) to 1 (certain).
I count the correct equally likely outcomes and simplify the fraction.
I subtract from 1 when finding a missing or opposite probability.
I multiply probability by the number of trials or the population.
I calculate relative frequency using the observed results.
I use sample-space tables and do not double-count overlaps.
I multiply along a path and add alternative paths.
I recalculate branch probabilities after a draw without replacement.