Worked example · Easy
Read a bar chart
A bar chart shows frequencies 6, 9, 5 and 10 for four clubs. Find the total and the most popular club.
Total \(=6+9+5+10=\boxed{30}\). The fourth club is most popular, with \(\boxed{10}\) members.
Learn how to draw and interpret the statistical diagrams, estimate results correctly, and communicate conclusions accurately.
Subtopic 1
Bar charts display frequencies for categories or discrete groups. The horizontal axis shows categories and the vertical axis shows frequency. Bars usually have equal widths and clear gaps because each category is separate.
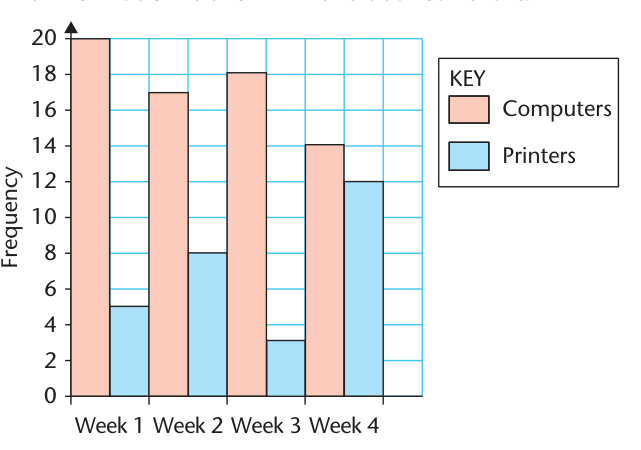
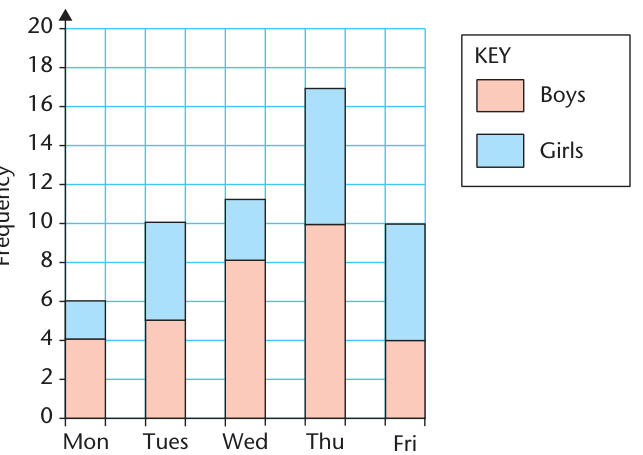
With dual (comparative) bar charts, two adjacent bars represent groups in the same category. Composite (stacked) bar charts stack the groups, showing the total and the composition simultaneously. Always use a labelled scale and a key.
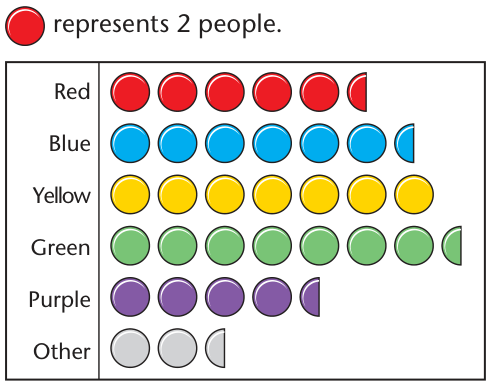
A pictogram uses symbols to represent frequencies. First read the key: a half-symbol represents half the stated frequency. Never assume that one drawing means one observation.
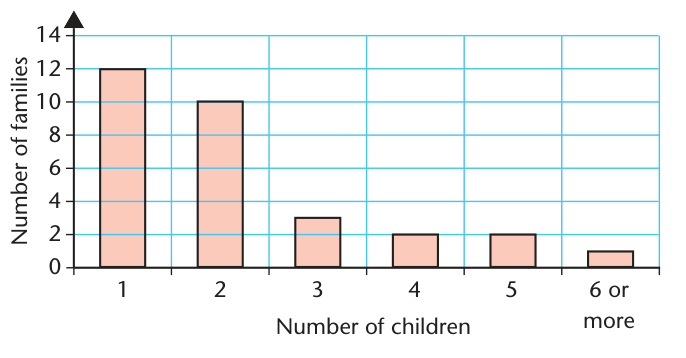
A bar chart shows frequencies 6, 9, 5 and 10 for four clubs. Find the total and the most popular club.
Total \(=6+9+5+10=\boxed{30}\). The fourth club is most popular, with \(\boxed{10}\) members.
One complete symbol represents 4 people. A category contains 6 full symbols and a half-symbol. How many people are in it?
For three weeks, a shop sells 12, 17 and 11 laptops and 8, 13 and 16 tablets. How many more laptops than tablets were sold in total?
A composite bar chart for a survey has two stacked groups. One bar reaches 42 altogether, with the lower segment ending at 18. Find the upper-group frequency and the fraction of the total.
Subtopic 2
A pie chart divides a circle into sectors. Each sector angle represents its share of the total. A whole circle is \(360^\circ\), so the angles must add to \(360^\circ\).
To recover a frequency, divide the sector angle by \(360^\circ\), then multiply by the total number of observations. If the total is unknown, a pie chart shows proportions but does not reveal absolute frequencies.
For accurate construction, calculate each angle, draw a circle, measure sectors using a protractor, label each category and check the total. Use a sensible legend for narrow sectors.
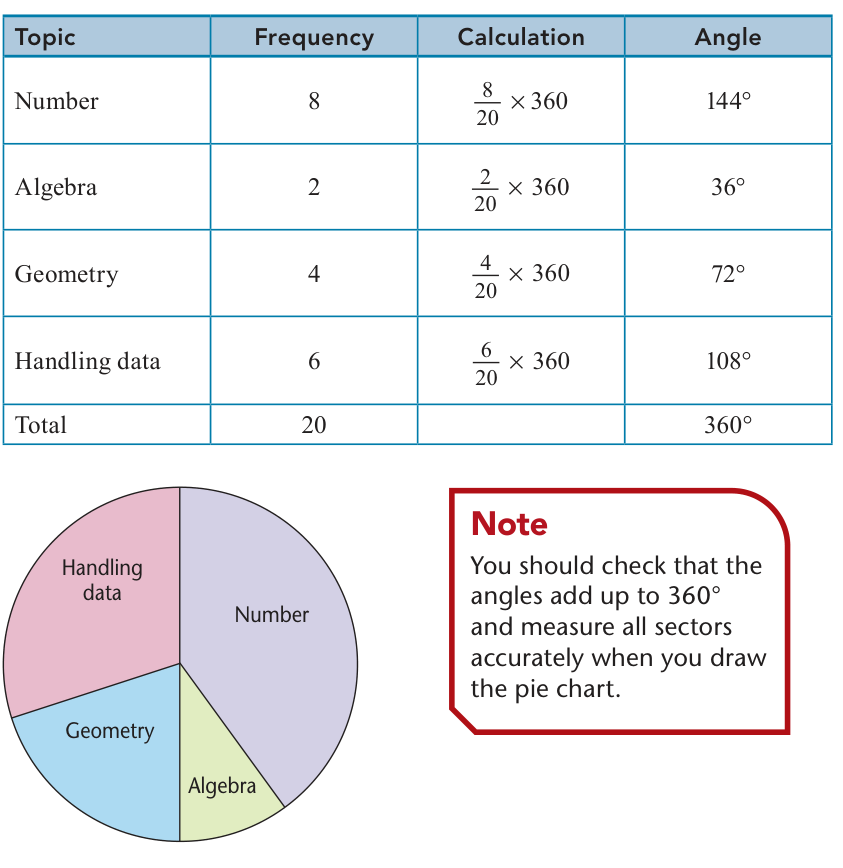
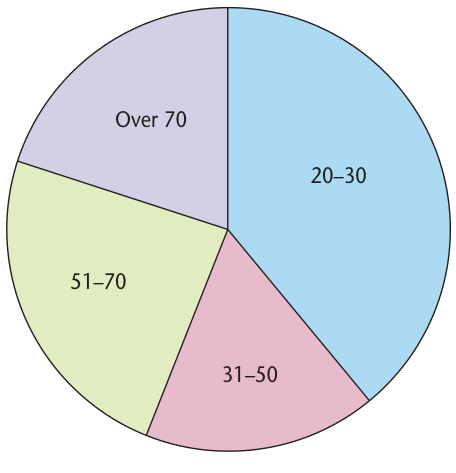
9 out of 36 pupils choose football. Find the sector angle.
A sector measures \(54^\circ\) in a pie chart representing 120 customers. How many customers are in this category?
Four activities attract 14, 21, 7 and 28 pupils. Calculate the four angles.
Total \(=14+21+7+28=70\).
\[\frac{14}{70}\times360=72^\circ,\quad\frac{21}{70}\times360=108^\circ\]\[\frac7{70}\times360=36^\circ,\quad\frac{28}{70}\times360=144^\circ\]Check: \(72+108+36+144=360^\circ\).
A sector of \(144^\circ\) represents pupils who travel by bus. There are 48 such pupils. Find the total number surveyed.
The sector is \(144/360=2/5\) of the whole.
\[\frac25N=48\implies N=48\times\frac52=\boxed{120}\]Subtopic 3
A scatter diagram plots paired numerical observations as points \((x,y)\). First label both axes with units and sensible scales. The pattern of dots suggests a relationship called correlation.
Patterns may be strong or weak depending on how closely points follow the overall trend. A straight line of best fit is drawn by eye through the middle of correlated data, with points reasonably balanced on each side. It need not pass through all points or through the origin.
Use the line to estimate unknown values within the data range (interpolation). An estimate beyond the data range is an extrapolation and is less reliable. Correlation alone does not prove one quantity causes changes in the other.
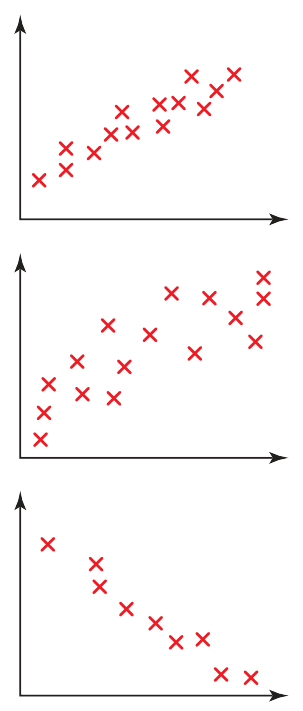
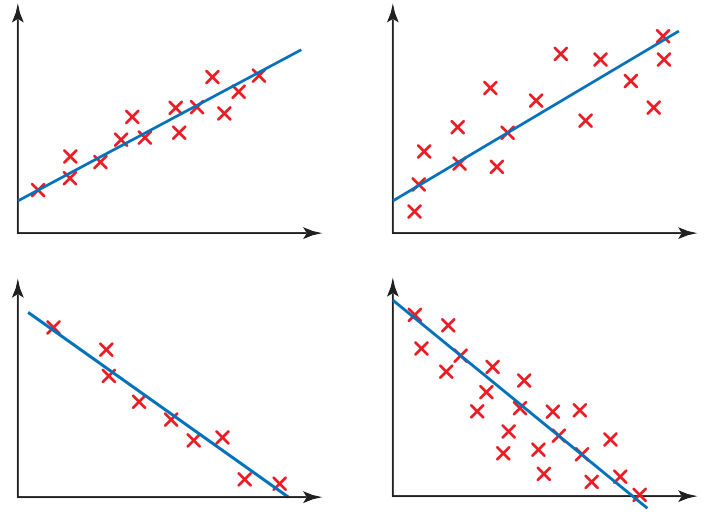
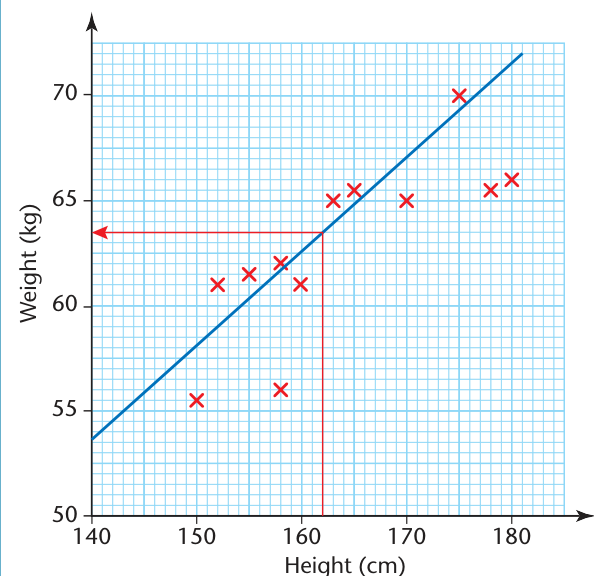
On a scatter diagram the points slope downwards from left to right. Identify the correlation.
As \(x\) increases, \(y\) generally decreases. This is negative correlation.
A line of best fit passes through approximately \((2,15)\) and \((8,39)\). Estimate \(y\) when \(x=5\).
Estimated gradient \(=(39-15)/(8-2)=4\). Equation \(y=4x+7\).
\[y(5)=4(5)+7=\boxed{27}\]Data were collected for ages from 10 to 16 years. Explain why using the best-fit line to predict a value for a 65-year-old would be unreliable.
65 is far outside the 10–16 age range. This would be extrapolation, and the observed linear trend may not continue that far.
A scatter plot of ice-cream sales and beach attendance shows a strong positive correlation. A report claims buying ice cream causes more people to visit the beach. Explain whether this follows.
No. Positive correlation means the two quantities tend to increase together, but it does not prove causation. Hot weather could make both ice-cream sales and beach attendance rise.
Subtopic 4
Cumulative frequency is a running total: the number of observations up to a given value or upper class boundary. First make a cumulative-frequency table by adding each new class frequency to the previous total.
For continuous grouped data, plot cumulative frequency against the upper class boundary, and include a starting point at the lower boundary of the first group with cumulative frequency 0. Draw a smooth, increasing curve (an ogive).
To estimate how many items are below a value, read upwards from the measurement to the curve, then across to the cumulative-frequency axis. To find the number above a value, subtract that cumulative frequency from the total. Values read from grouped-data curves are estimates, not exact counts.
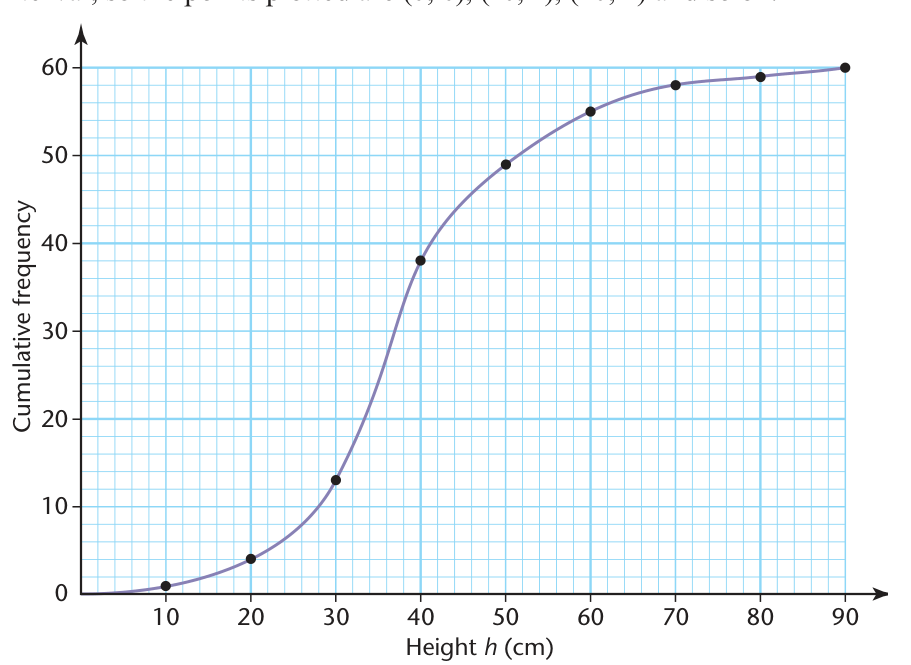
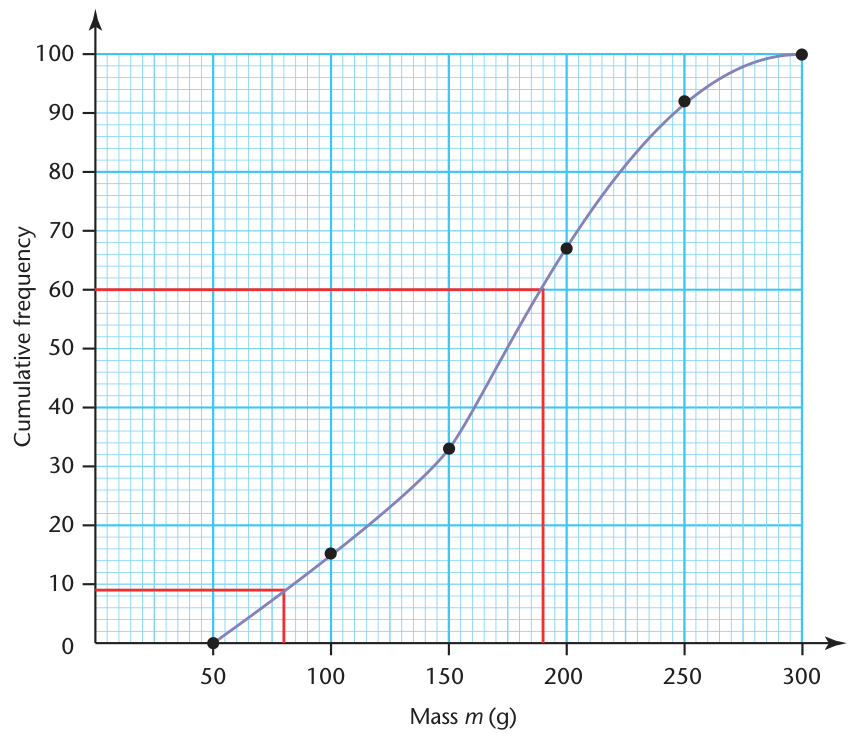
Four consecutive groups have frequencies 5, 8, 12 and 5. List the cumulative frequencies.
Cumulative frequency row: \(\boxed{5,13,25,30}\).
A cumulative frequency graph for 80 parcels shows 29 parcels below 3 kg. Estimate how many weigh 3 kg or more.
At the upper boundaries 10, 20, 30 and 40, the cumulative frequencies are 4, 20, 44 and 60. Assuming an even spread within the 20–30 class, estimate how many observations are below 25.
The 20–30 class has \(44-20=24\) observations. 25 is halfway through this class.
\[CF(25)\approx20+\frac{25-20}{30-20}\times24=20+12=\boxed{32}\]Subtopic 5
The median divides ordered data into two equal halves and corresponds to the 50th percentile. The lower quartile \(Q_1\) is the 25th percentile, and the upper quartile \(Q_3\) is the 75th percentile. A general percentile describes the value at or below which a given percentage of observations lie.
Read the estimated median and quartiles by starting at \(N/2\), \(N/4\) and \(3N/4\) on the cumulative-frequency axis, moving across to the curve and then down to the measured-value axis. These graphical estimates differ slightly depending on the curve drawn.
The interquartile range (IQR) measures the spread of the central half of the data and is less affected by extreme values than the overall range. When comparing distributions, consider both the typical value and the spread.
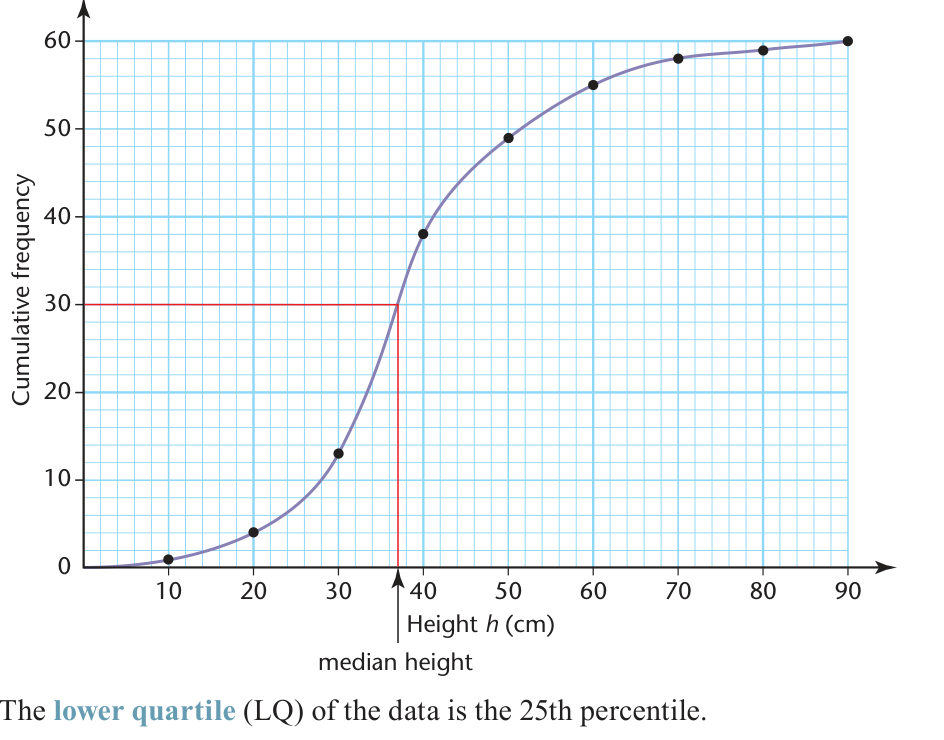
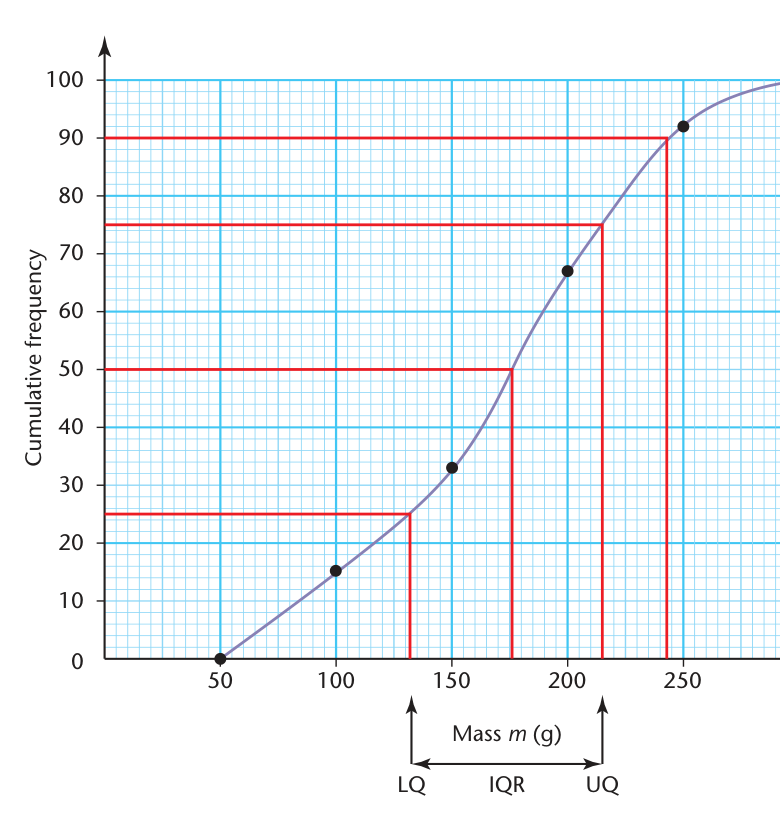
There are 120 measurements. At which cumulative-frequency levels should you read the lower quartile, median and upper quartile?
A cumulative-frequency graph gives \(Q_1=22.5\) cm and \(Q_3=37.8\) cm. Find the IQR.
A distribution has 150 readings. Which cumulative-frequency level corresponds to the 80th percentile?
Read across from cumulative frequency 120 to the curve, then down to the horizontal axis.
For Group A, median \(=42\) and quartiles \(31,55\). For Group B, median \(=39\) and quartiles \(35,46\). Which group has the higher typical value, and which is more consistent?
Group A has the greater median: \(42>39\). Its IQR is \(55-31=24\). Group B has IQR \(46-35=11\). Therefore Group A has the higher typical value, while Group B is more consistent (smaller central spread).
Subtopic 6
A histogram displays grouped continuous data. The bars touch because the class intervals are adjacent. Unlike an ordinary bar chart, the area of a histogram bar, not just its height, is proportional to the number of observations.
On the horizontal axis use continuous class boundaries, and on the vertical axis use frequency density. If class widths are unequal, the tallest bar is not necessarily the class with the greatest frequency. The modal class is the class represented by the highest density bar.
To estimate the mean from a grouped frequency table or a histogram, recover the frequencies (using bar area if necessary), multiply each frequency by its class midpoint and divide by the total frequency.
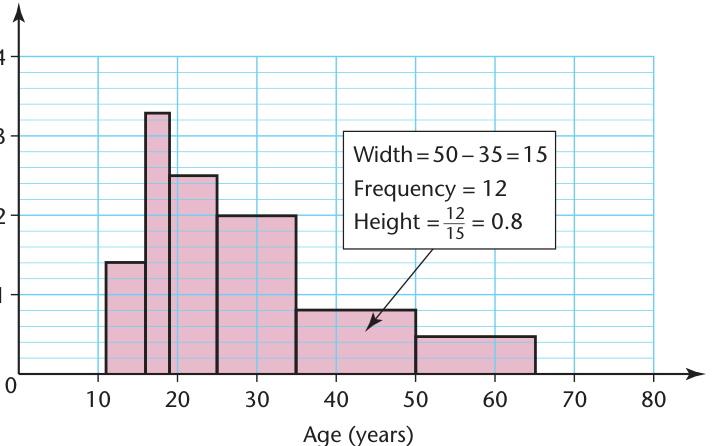
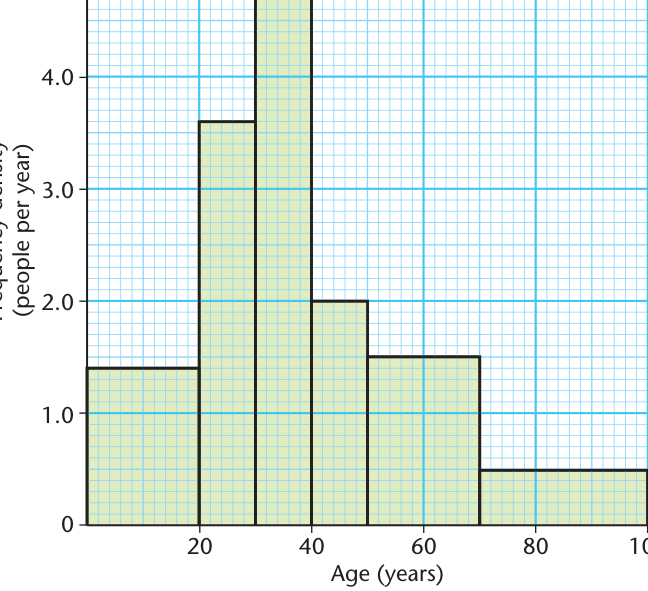
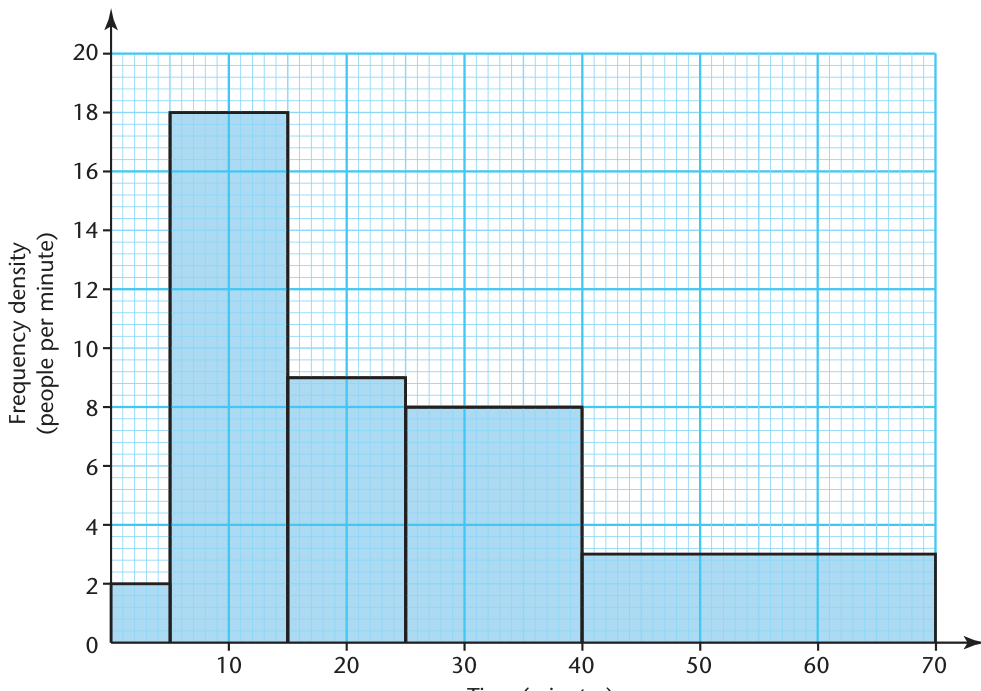
A class has frequency 18 and width 6. Find its frequency density.
A histogram bar extends from 20 to 35 on the horizontal axis, and has a frequency density of 2.4. Find the frequency.
Class A covers 0–5 with frequency 18. Class B covers 5–20 with frequency 30. Calculate both histogram heights and identify the taller bar.
Class A is taller although B has greater frequency.
Three grouped intervals 0–10, 10–20 and 20–40 have frequency densities 1.2, 1.8 and 0.6. Estimate the mean.
Frequencies are \(10(1.2)=12\), \(10(1.8)=18\) and \(20(0.6)=12\). Midpoints are \(5,15,30\).
\[\bar x\approx\frac{5(12)+15(18)+30(12)}{12+18+12}=\frac{690}{42}=\boxed{16.4}\quad(3\text{ s.f.})\]Independent practice
40 new exercises progress from basic questions to multi-step exam-style problems. Try each question before opening Show Answer to see the method and answer.
Five bars have frequencies 4, 7, 9, 6 and 4. How many observations are represented?
A bar chart shows 11, 8, 14 and 7 people in categories A, B, C and D. State the modal category.
C has the largest frequency (14), so category C is modal.
A full symbol represents 6 books. How many books do 4 complete symbols represent?
A full symbol represents 8 students. How many students do 3 full symbols and one quarter-symbol represent?
A chart shows 18 girls and 14 boys took a subject. How many more girls took it?
A stacked bar reaches frequency 28. Its lower section reaches 17. What is the frequency in the top section?
5 of 20 respondents chose swimming. Find the sector angle.
A sector measures \(72^\circ\). What percentage of a circle does it represent?
A pie chart represents 90 voters. One sector measures \(120^\circ\). Find its frequency.
The plotted points rise from left to right. What correlation is shown?
This is positive correlation: the quantities generally increase together.
The plotted points fall from left to right. What correlation is shown?
This is negative correlation: one quantity generally decreases as the other increases.
Points in a scatter diagram have no clear pattern. What conclusion about correlation can you draw?
There is no clear correlation between the variables.
A table has frequencies 3, 7, 5, 9. Give the running totals.
The cumulative frequencies are \(\boxed{3,10,15,24}\).
A grouped class is \(20\le x<30\). At which horizontal-axis value should its cumulative total be plotted?
Plot the cumulative total at the upper class boundary 30.
A cumulative-frequency graph represents 84 objects. At which cumulative-frequency value do you locate the median?
A cumulative-frequency graph represents 200 results. Give the CF levels for \(Q_1\) and \(Q_3\).
The lower and upper quartiles are 16 and 29. Find the interquartile range.
A histogram group has width 5 and frequency 35. Calculate its frequency density.
A survey of 60 students gives categories with frequencies 15, 20 and 25. Calculate all sector angles.
Check: \(90+120+150=360^\circ\).
A pie chart has sectors \(45^\circ\), \(90^\circ\), \(135^\circ\) and one unknown sector. Find its angle and its percentage of the total.
A \(54^\circ\) sector represents 18 pupils. Find the total number of pupils.
A straight best-fit line passes through (1, 7) and (5, 23). Estimate \(y\) when \(x=4\).
Measurements only cover 30–60 minutes. Explain why predicting a value at 200 minutes using their trend line is questionable.
200 minutes is outside the range of the original observations. The prediction is extrapolation, and the trend may not continue.
Class frequencies are 8, 12, 21, 9 and 10. Write a cumulative-frequency row and find the total.
The total is 60 observations.
In a sample of 150, the cumulative frequency below 26 is 92. Estimate how many values are at least 26.
For 240 measurements, find the cumulative frequency at which to read the 90th percentile.
A density bar from 12 to 20 has height 4.5. Find the frequency.
A shop sells drinks A and B in four periods. A sells 14, 20, 18, 16; B sells 11, 17, 22, 14. Find each total and the percentage of all sales that were B.
A pie chart of 150 people has sector angles 96°, 120° and 72°, plus a final sector. Find the final angle and its frequency.
Three groups occur in the ratio 2:3:4. Calculate the sector angle for the largest group.
Total parts \(=2+3+4=9\); largest group has 4 parts.
\[\frac49\times360^\circ=\boxed{160^\circ}\]A set of exam scores has median 68, lower quartile 55 and upper quartile 81. Another has median 66, lower quartile 61 and upper quartile 76. Which has the larger median and which has the smaller IQR?
First median: \(68>66\), so the first is higher.
\[\mathrm{IQR}_1=81-55=26\]\[\mathrm{IQR}_2=76-61=15\]The second group has the smaller IQR and is more consistent.
Cumulative frequencies at upper boundaries 20 and 30 are 34 and 58. Estimate the cumulative frequency at 27, assuming the data are uniformly spread in this class.
Class frequency \(=58-34=24\). 27 is \(7/10\) of the way through.
\[34+\frac7{10}(24)=34+16.8=\boxed{50.8}\]About 51 observations.
Three histogram classes of widths 4, 6 and 10 have densities 5, 3 and 1.2. Calculate the total frequency and identify the modal class.
The first class is modal (highest density 5).
A class has frequency 24 and extends from 35 to 47. Find its histogram height.
A histogram has groups 0–5 (density 2), 5–15 (density 3) and 15–25 (density 1). Estimate the mean value.
Widths \(5,10,10\); frequencies \(10,30,10\); midpoints \(2.5,10,20\).
\[\bar x\approx\frac{10(2.5)+30(10)+10(20)}{10+30+10}=\frac{525}{50}=\boxed{10.5}\]There are 160 race times in a cumulative-frequency diagram. Give the cumulative-frequency values for the median, lower quartile, upper quartile and 75th percentile.
The 75th percentile is also at 120. Use these levels to read the corresponding times from the curve.
A histogram has one class 10–20 with density 2 and another class 20–50 with density 0.8. Which class contains more observations?
The 20–50 class contains more observations, despite its shorter bar.
A scatter diagram shows a strong negative correlation between daily rainfall and sunshine hours. State the relationship and explain why it does not prove rainfall alone determines sunshine.
Higher rainfall tends to be associated with fewer sunshine hours: strong negative correlation. The relationship is observational, and both may be affected by other weather conditions. Correlation does not establish a sole cause.
Group A has 100 times with median 28 min, \(Q_1=21\) and \(Q_3=40\). Group B has median 31 min, \(Q_1=28\) and \(Q_3=35\). Which is usually faster, and which has less variation?
A has the lower median time (28 rather than 31), so A is usually faster.
\[\mathrm{IQR}_A=40-21=19\]\[\mathrm{IQR}_B=35-28=7\]Group B has less variation in its central half.
A histogram group has width 12 and density 2.5. The next group has width 5 and frequency 20. Find the density of the next group and the combined frequency.
Exam checklist