Inter-Firm Comparison
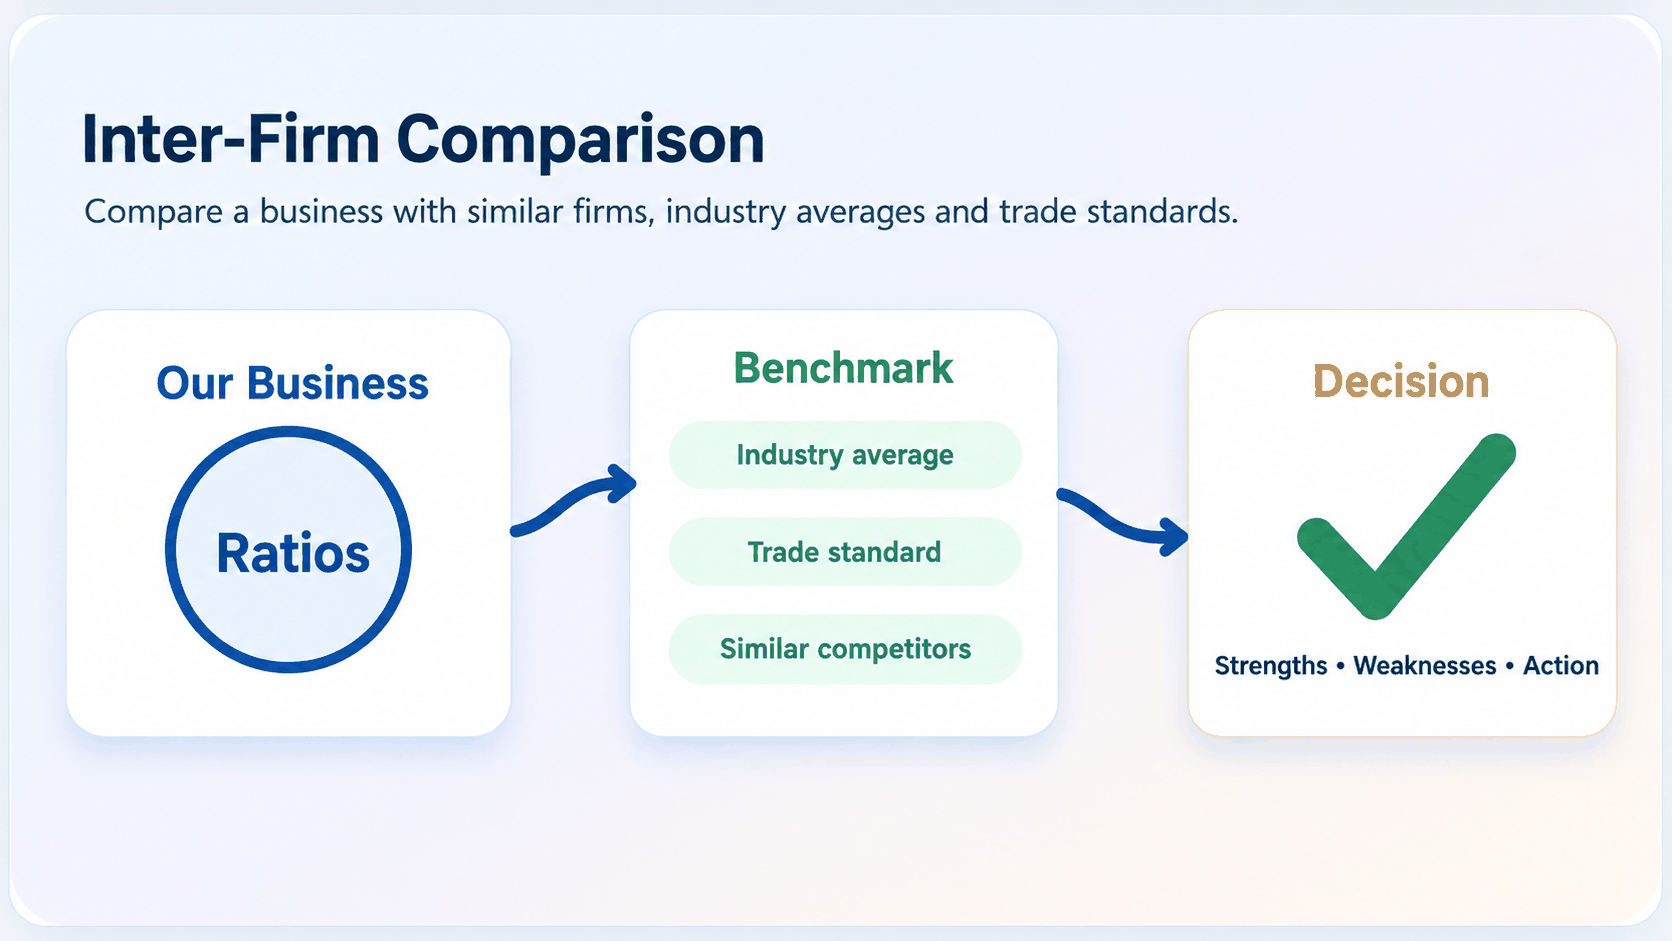
Inter-firm comparison means comparing the financial performance and position of one business with another similar business. A business may perform well compared with last year but still perform poorly compared with competitors, so ratios help judge performance against other firms in the same industry.
Topic 1: Meaning and Purpose of Inter-Firm Comparison
Inter-firm comparison uses accounting ratios to compare a business with competitors, industry averages and trade standards.
1. What is Inter-Firm Comparison?
A business may look successful when compared with its own previous year, but still be performing poorly compared with other firms in the same industry. This is why ratios are useful for judging performance against competitors.
2. Why Use Inter-Firm Comparison?
Accounting ratios allow a business to:
- Compare itself with competitors.
- Compare itself with the industry or trade average.
- Identify strengths and weaknesses.
- Assess profitability, liquidity and efficiency.
- Make better decisions.
- Identify areas needing improvement.
3. Ratios are Better than Absolute Figures
Absolute figures can be misleading. A larger profit does not always mean better performance if much more capital was used to earn that profit.
Example: Profit alone can mislead
Topic 2: Problems with Inter-Firm Comparison
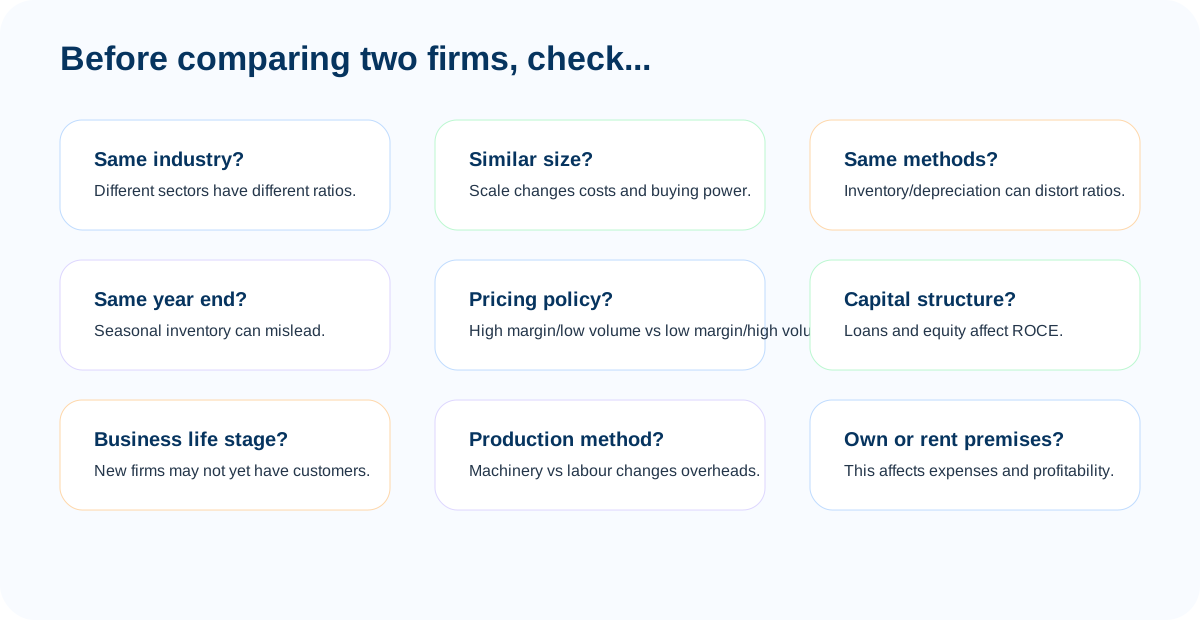
Comparisons are most useful when businesses are genuinely similar and use similar accounting methods.
4. Problem 1 – Businesses Must be in the Same Industry
Businesses should normally be compared only if they operate in the same industry. Comparing a supermarket with an electronics shop would not be very useful.
5. Problem 2 – Businesses Should be Similar in Size
Even businesses in the same industry may be difficult to compare if one is much larger. A large supermarket and a small convenience store may sell similar products, but their sales volumes, expenses, purchasing power and inventory levels may be very different.
6. Problem 3 – Different Accounting Methods
Businesses should ideally use the same accounting methods. Differences may exist in:
- Inventory valuation.
- Methods of depreciation.
These differences can change profit, asset values and accounting ratios, which may make comparisons misleading.
7. Problem 4 – Different Financial Year Ends
Businesses being compared should ideally have similar financial year ends.
8. Problem 5 – Different Pricing Policies
Business A
- Higher selling prices.
- Lower volume of sales.
- Higher profit margin.
Business B
- Lower selling prices.
- Higher volume of sales.
- Lower profit margin.
Different ratios do not always mean one business is being badly managed; the firms may be following different pricing strategies.
9. Problem 6 – Different Capital Structures
Some businesses may use loans while others rely mainly on owner's equity. This changes their capital employed and can affect ROCE. ROCE should therefore be compared carefully when businesses have different methods of financing themselves.
10. Other Problems with Comparison
Stage of business life
A new business may not yet have established customers, strong sales or a loyal customer base, so comparing it with a long-established business may be unfair.
Production methods
One business may use more machinery while another uses more workers. Their overhead costs will therefore differ.
Owning vs renting premises
One business may own its premises while another rents. This can affect expenses and profitability ratios.
Topic 3: Kelsey Inter-Firm Comparison Example
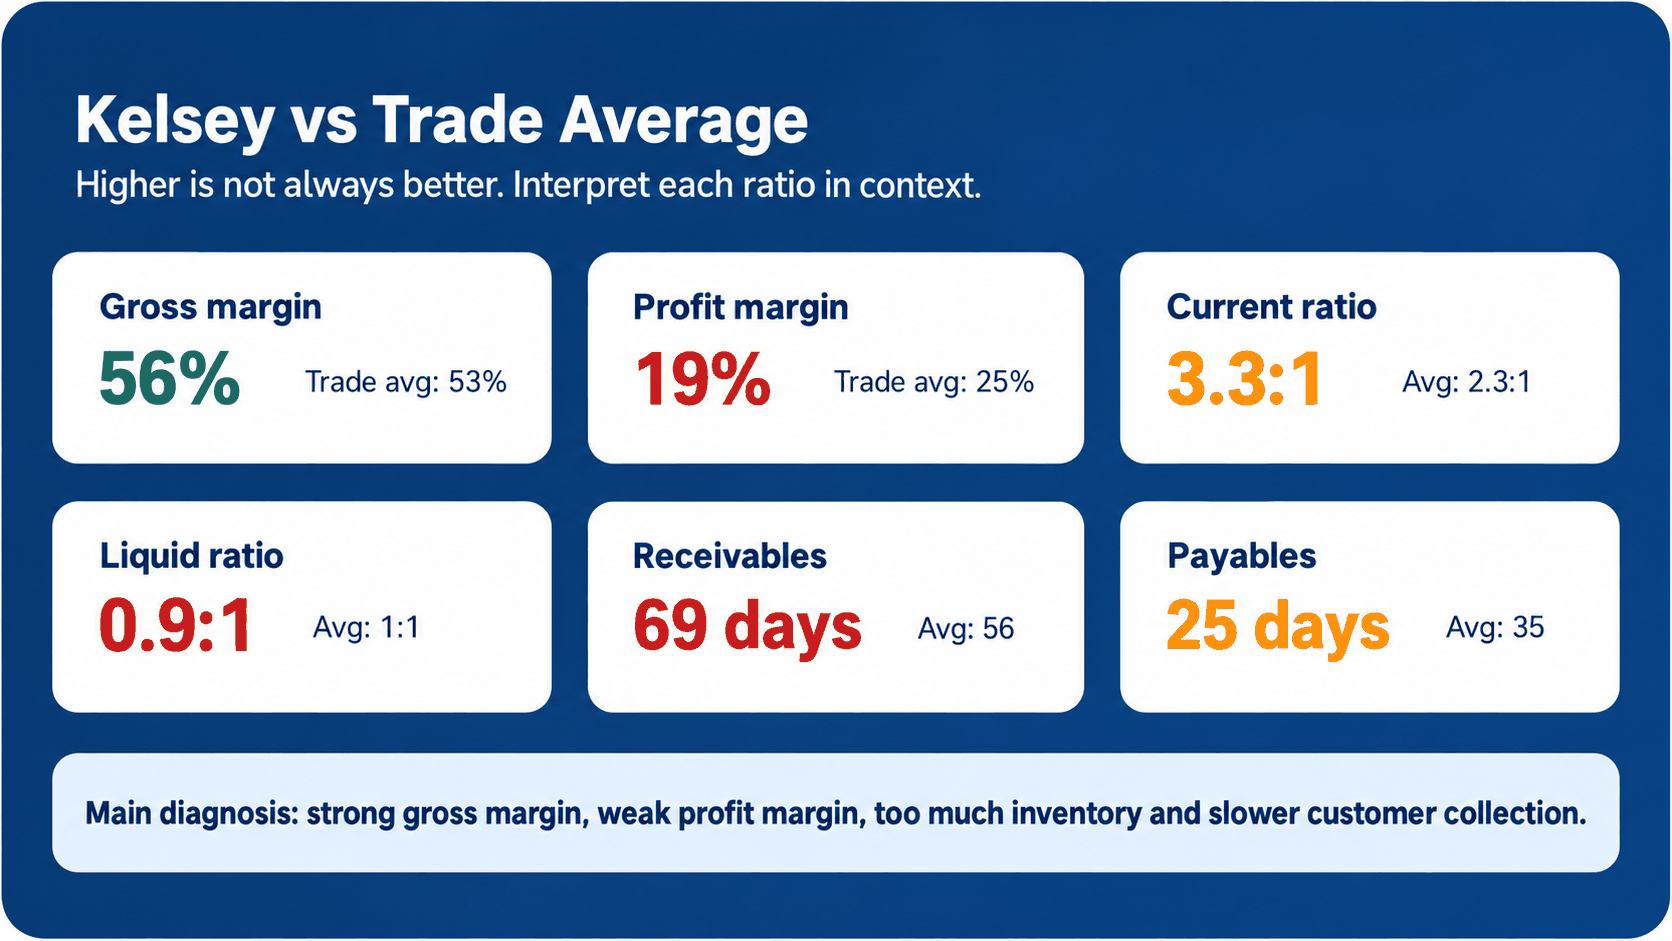
The chapter compares Kelsey's ratios with the average for her trade and shows how each ratio should be interpreted.
11. Example of Inter-Firm Comparison
| Ratio | Trade Average | Kelsey |
|---|---|---|
| Gross margin | 53% | 56% |
| Profit margin | 25% | 19% |
| Current ratio | 2.3 : 1 | 3.3 : 1 |
| Liquid ratio | 1 : 1 | 0.9 : 1 |
| Trade receivables turnover | 56 days | 69 days |
| Trade payables turnover | 35 days | 25 days |
12. Interpreting Gross Margin
Kelsey's gross margin is 56%, while the trade average is 53%. This means Kelsey earns $56 gross profit for every $100 of sales compared with the industry average of $53.
13. Interpreting Profit Margin
Kelsey's profit margin is 19%, while the trade average is 25%. For every $100 of sales:
- Kelsey makes $19 profit.
- Competitors make approximately $25 profit.
14. Expenses-to-Sales Comparison
Kelsey
Gross margin = 56%
Profit margin = 19%
Difference = 37%
Trade average
Gross margin = 53%
Profit margin = 25%
Difference = 28%
Kelsey spends $37 per $100 of sales on expenses, while the trade average spends only $28. This suggests that Kelsey's expense control is less efficient.
15. How Could Profitability Be Improved?
Kelsey could:
- Reduce waste.
- Reduce electricity and water usage.
- Train staff to reduce wastage.
- Move to cheaper or smaller premises.
- Reduce unnecessary staff costs.
- Outsource some work.
- Use lower-cost marketing and distribution methods.
Topic 4: Liquidity and Efficiency Comparisons
Liquidity and efficiency ratios must be judged against business context, trade averages and credit terms.
16. Interpreting Current Ratio
Kelsey's current ratio is 3.3 : 1, while the trade average is 2.3 : 1. Although Kelsey's ratio is higher, the textbook considers this less favourable because she may be holding too many current assets.
17. Interpreting Liquid Ratio
Kelsey's liquid ratio is 0.9 : 1, compared with the trade average of 1 : 1. Her liquid ratio is lower, indicating that she may have difficulty meeting current liabilities from her most liquid assets.
18. Trade Receivables Turnover
Kelsey's customers take 69 days to pay, while the trade average is 56 days. Her customers therefore take:
This is unfavourable because money remains tied up in trade receivables for longer.
Possible Improvements
- Better credit control.
- Chase overdue customers.
- Offer cash discounts for prompt payment.
19. Trade Payables Turnover
Kelsey pays suppliers in 25 days, while the trade average is 35 days. She is therefore paying suppliers 10 days earlier than the industry average.
20. Improving Liquidity
The chapter suggests that Kelsey could:
- Improve credit control.
- Chase trade receivables.
- Increase cash sales.
- Reduce credit sales.
- Delay paying trade payables where appropriate.
- Still pay suppliers within agreed credit terms.
Topic 5: Exam Answer Technique
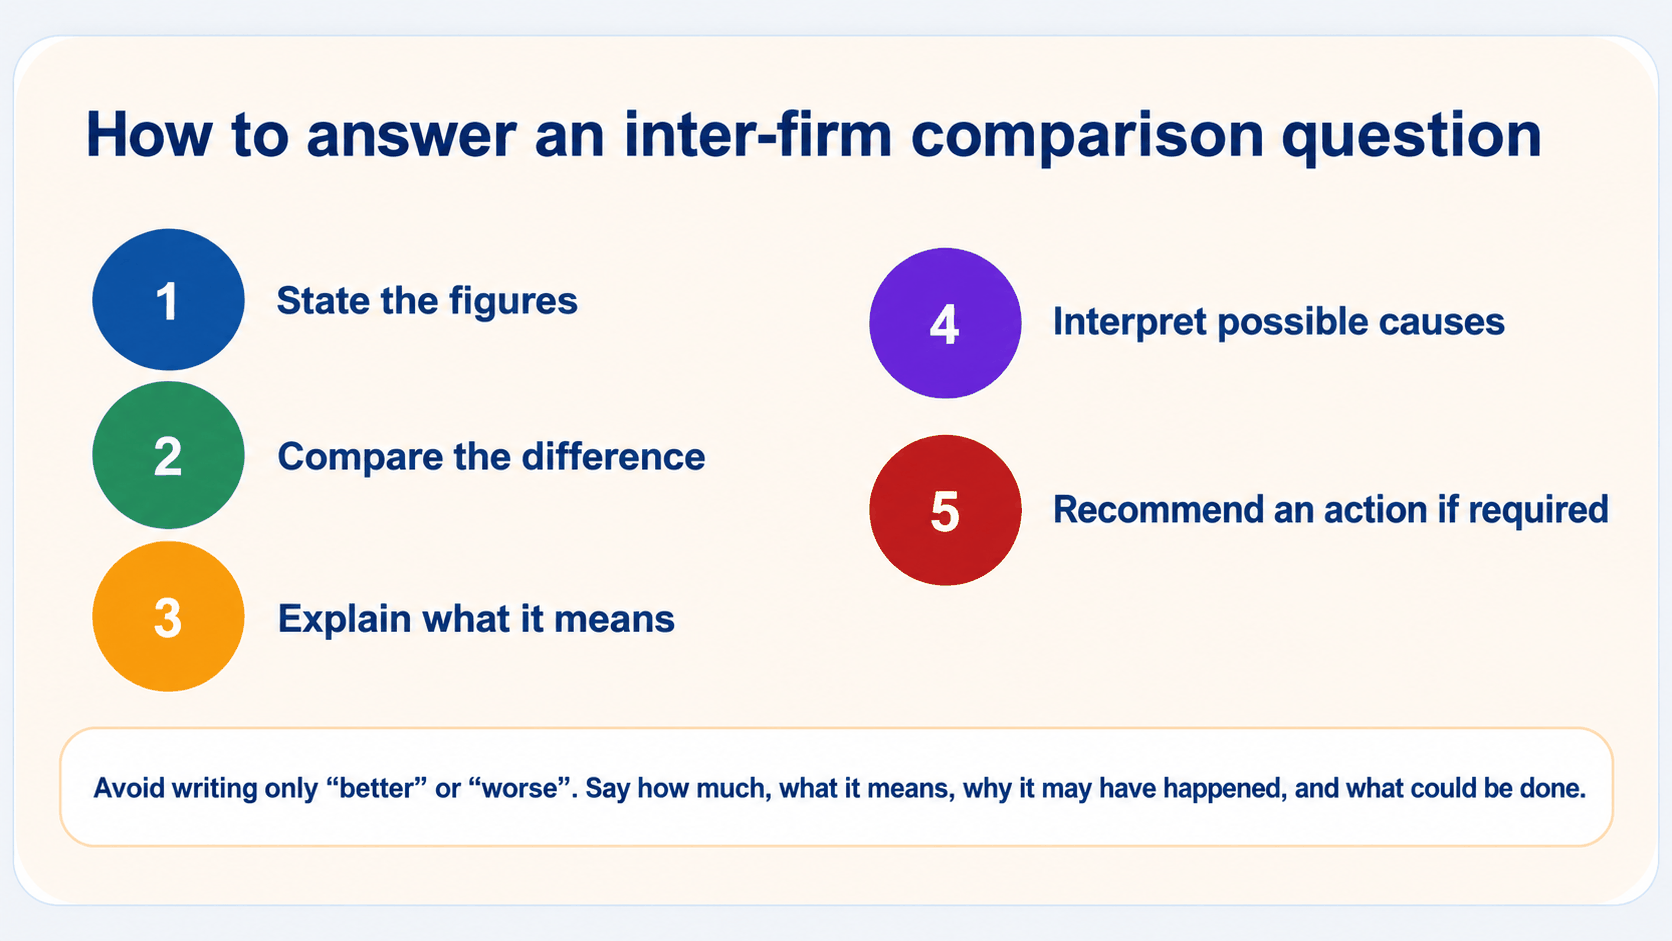
A strong comparison answer states figures, compares them, explains the meaning, interprets causes and recommends action when required.
21. How to Answer an Inter-Firm Comparison Question
| Step | Example |
|---|---|
| State the figures | Business A has a gross margin of 40%, compared with Business B's 30%. |
| Compare | Business A's gross margin is 10 percentage points higher. |
| Explain | Business A earns $40 gross profit per $100 of sales compared with $30 for Business B. |
| Interpret | Business A may have lower cost of sales or higher selling prices. |
| Recommend if required | Business B could investigate cheaper suppliers or its selling-price policy. |
Quick Guide to Comparing Ratios
| Ratio | Usually favourable compared with competitor |
|---|---|
| Gross margin | Higher |
| Profit margin | Higher |
| ROCE | Higher |
| Current ratio | Appropriate for the industry, not simply highest |
| Liquid ratio | Adequate and close to industry norm |
| Inventory turnover | Usually faster, depending on industry |
| Trade receivables days | Lower |
| Trade payables days | Effective use of supplier credit period |
Key Problems with Inter-Firm Comparison
Before deciding that one business is better, ask:
- Are they in the same industry?
- Are they of a similar size?
- Do they have similar financial year ends?
- Do they use similar accounting methods?
- Do they use similar pricing policies?
- Are their capital structures similar?
- Are they at the same stage of the business life cycle?
- Do they use similar production methods?
- Do they both own or rent their premises?
Remember
Inter-Firm Comparison
Compare ratios, not just absolute figures.
Benchmarking
Compare business performance with an industry or trade standard.
Good Comparison
Businesses should have similar industry, size, accounting methods and circumstances.
Most Important Exam Point
Do not automatically assume that the highest ratio is the best ratio. Interpret the ratio in the context of the business and the industry.