Measure inflation
Construct and interpret index numbers, calculate inflation from a price index and explain how a consumer price index is built.

Price stability means keeping inflation low and reasonably predictable rather than allowing the general price level to rise or fall rapidly. This chapter explains how inflation is measured using price indices, how to distinguish inflation from deflation and disinflation, what can cause the price level to rise, and why unstable inflation can damage economic performance.
Construct and interpret index numbers, calculate inflation from a price index and explain how a consumer price index is built.
Distinguish inflation, deflation, disinflation and hyperinflation without confusing a falling inflation rate with falling prices.
Use AD/AS analysis to explain cost-push and demand-pull pressures and distinguish one-off price-level changes from persistent inflation.
Analyse how inflation can affect investment, resource allocation, income distribution, wages, transactions and economic confidence.
Governments usually want a stable macroeconomic environment. Price stability does not normally mean that every price stays unchanged or that inflation is exactly zero. It means avoiding high, volatile or unpredictable changes in the general price level.
Why is stability important? Firms make investment decisions partly on expectations of future revenues and costs. When inflation is high and volatile, planning becomes more difficult and expected real returns on investment become less certain. This can discourage investment and therefore weaken future economic growth.
An index number expresses the value of a variable relative to a chosen base value. The base is normally set equal to 100. Index numbers are useful because they make changes through time easy to compare.
A consumer price index is designed to measure the general level of prices faced by households. It does not simply average every price equally. Goods and services that take a larger share of household spending receive a larger weight.
| Measure | What it tells you | Example |
|---|---|---|
| Price index | The level of prices relative to a base period. | CPI = 130 means the weighted basket is 30% more expensive than in a base period of 100. |
| Inflation rate | How quickly the price index is rising. | CPI rising from 125 to 130 gives 4% inflation. |
The general price level is rising.
The general price level is falling; the inflation rate is negative.
The inflation rate is falling but remains positive, so prices are still rising more slowly.
Inflation has reached an extreme or excessive rate and the value of money falls very rapidly.
If consumers expect prices to continue falling, they may postpone spending. Firms may also become pessimistic about future sales and reduce investment. Weaker aggregate demand can then contribute to lower output and higher unemployment. The seriousness depends on why prices are falling and how expectations respond.
A rise in the general price level can begin on either the supply side or the demand side of the economy. It is important to distinguish a one-off rise in the price level from a continuing process of inflation.
Cost-push inflation begins with higher costs of production. Examples include a rise in wages not matched by productivity, higher energy or raw-material prices, or other increases in firms' costs. Firms become willing to supply less output at each price level, shifting aggregate supply left.
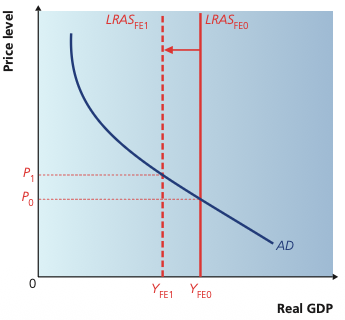
A permanent rise in a major production cost, such as oil, can reduce productive capacity. LRAS shifts left from LRASFE0 to LRASFE1, real GDP falls from YFE0 to YFE1, and the price level rises from P₀ to P₁. This is the book's AD/AS illustration of cost-push pressure.
Adapted from Cambridge International AS & A Level Economics, Second Edition, by Peter Smith (with Adam Wilby and Mila Zasheva).
Demand-pull inflation begins with an increase in aggregate demand. Higher consumption, investment, government spending or net exports can shift AD to the right. Tax reductions may also increase disposable income and spending. If the economy is close to full capacity, the effect on the price level can be particularly strong.
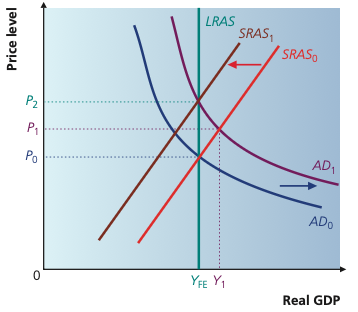
An increase in AD first raises real GDP and the price level in the short run. As costs rise, SRAS shifts left and output returns to YFE, leaving a higher price level. The diagram is useful for distinguishing a one-off rise in the price level from continuing inflation.
Adapted from Cambridge International AS & A Level Economics, Second Edition, by Peter Smith (with Adam Wilby and Mila Zasheva).
The textbook stresses that a single demand or supply shock produces a one-off change in the price level unless the process continues. In its framework, persistent inflation requires the money stock to grow persistently faster than real output. Continued growth of spending power can repeatedly shift aggregate demand to the right and sustain price increases.
| Cause | Initial change | Typical short-run result |
|---|---|---|
| Cost-push | Costs rise / SRAS shifts left | Higher price level and lower real output |
| Demand-pull | AD rises / AD shifts right | Higher price level and higher real output initially |
| Persistent excessive money growth | Spending power repeatedly increases faster than real output | Continuing upward pressure on the general price level |
A small, stable and predictable rate of inflation is not necessarily harmful. The textbook notes that many governments choose positive inflation targets rather than zero because moderate inflation can allow relative prices to change while avoiding widespread falls in money wages and prices. Problems become more serious when inflation is high, volatile or unexpected.
Unpredictable future prices make it harder for firms to estimate costs, revenues and the real return on investment. Investment may fall.
If inflation makes price signals harder to interpret, firms and consumers may make poorer decisions, causing resources to be misallocated.
People on fixed money incomes or with savings that do not keep pace with prices may lose purchasing power, potentially worsening inequality.
Workers may seek higher money wages to protect real incomes. If this raises firms' costs, it may add further inflationary pressure.
What matters for purchasing power is the change in money wages relative to inflation. For small percentage changes, a useful approximation is:
Costs to firms of changing quoted prices, catalogues, labels, systems and contracts more frequently when inflation is high.
Costs created when people try to minimise cash holdings because inflation and high nominal interest rates increase the opportunity cost of holding money.
At very high rates of inflation, people may become reluctant to hold or use money for ordinary transactions. This raises transaction costs and can reduce the effectiveness of markets. The problem can be worsened if taxes, benefits or pensions are not adjusted for inflation.
The effects depend on whether inflation was expected and whether incomes, interest rates and contracts adjust. People with fixed nominal incomes are vulnerable. Borrowers may benefit from unexpected inflation if they repay debt in money that has lost purchasing power, while lenders may lose. However, the chapter's main emphasis is that high and volatile inflation increases uncertainty throughout the economy.
20 questions. Each answer is marked immediately with a short explanation of why it is correct or incorrect.