
Chapter 33 · Market Research
Learn how businesses gather dependable information about customers and markets, choose suitable research methods and use the results to make better decisions.
Learning objectives
- Explain why businesses research customer needs, market gaps, product risks and decisions.
- Compare questionnaires, focus groups, observation, test marketing and secondary sources.
- Interpret qualitative and quantitative research and assess sample reliability.
- Evaluate research evidence from the example’s Sri Lanka, Manzini, Nescafé and Ford cases.
Purpose of Market Research
Market research involves collecting, presenting and analysing information about the marketing and consumption of goods and services. It helps a business understand what buyers want, examine its competitors, identify opportunities and make marketing decisions using evidence instead of guesswork. Research costs time and money, so managers must decide what information is worth gathering.
Example: Tourism in Sri Lanka
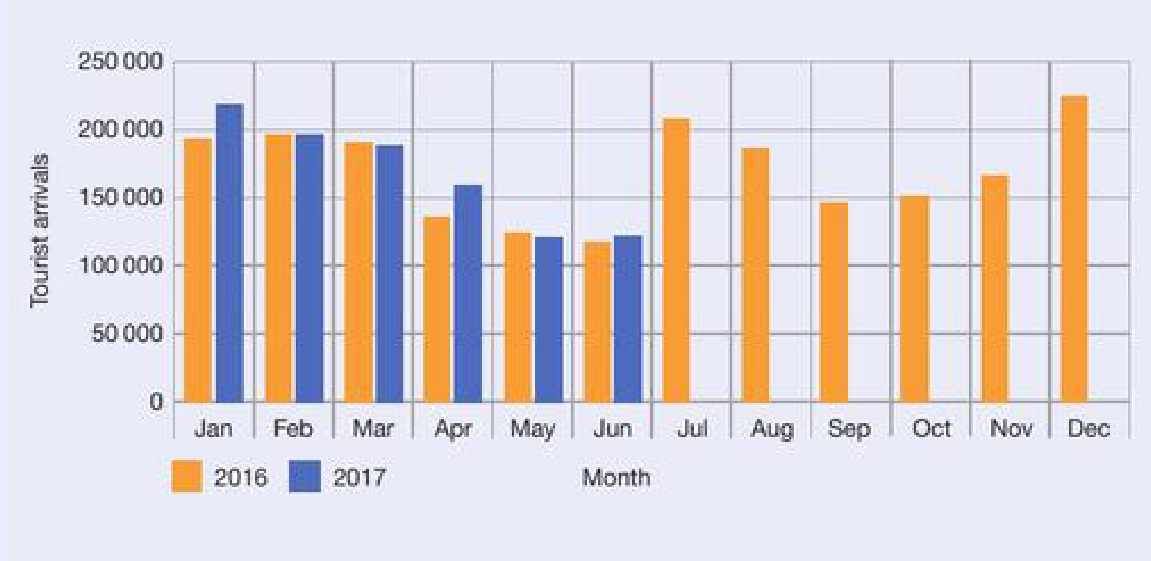
Sri Lanka recovering as a tourist destination after the 2004 tsunami and the end of the civil war in 2009. It reports 1,798,410 tourist arrivals in 2015 and shows tourist arrivals for 2016 and part of 2017 in Figure 33.1. Tourism organisations use arrival data to find busy seasons, choose when to advertise and plan staffing, accommodation and tours. The graph displays available months for 2017 rather than a complete second year.
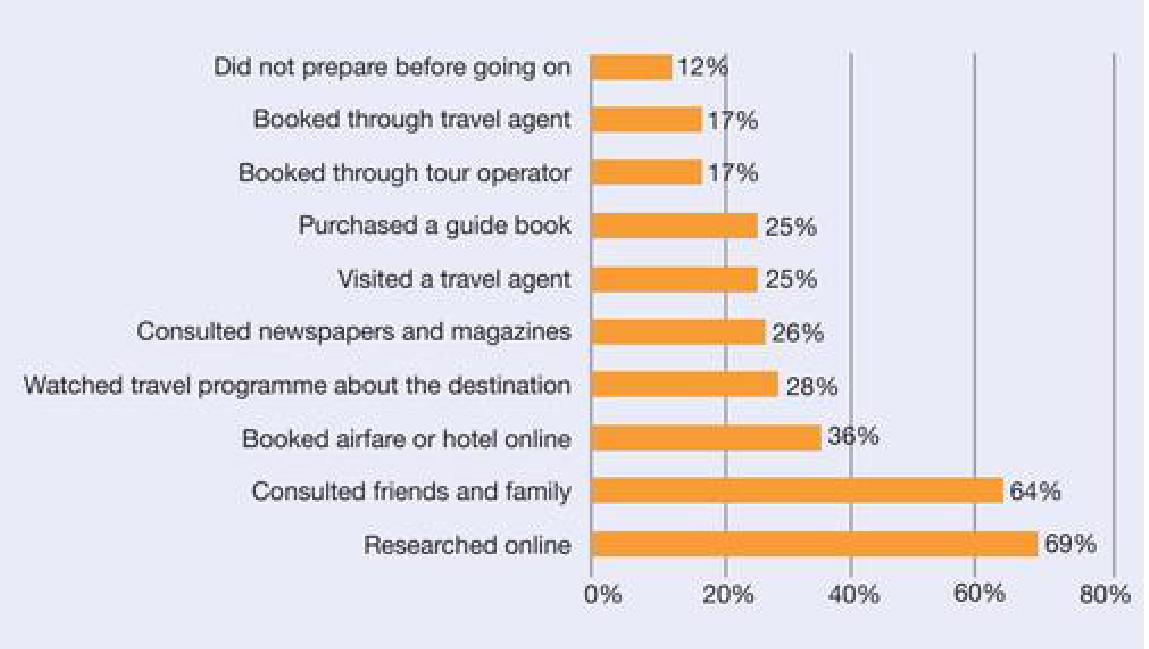
Sri Lanka also attracts tourists interested in beaches, history, wildlife and adventure holidays. Figure 33.2 reports how adventure travellers prepared for a trip. The highest reported activity was online research (69%), followed by asking friends and family (64%). A tour operator could use these findings to strengthen its website, publish helpful travel information and encourage customer recommendations.
To Identify and Understand Customer Needs
A business needs to find out which features matter to potential buyers. For example, a vacuum-cleaner manufacturer might ask customers about model design, colour, durability, efficiency, ease of handling and ease of storage. It can use the results to design a more suitable product instead of producing an expensive feature that customers do not value.
Good research also helps a business anticipate future customer needs by following changes in fashion, technology, lifestyles and product design. Managers should still test predictions because customer preferences can change.
To Identify Gaps in the Market
A gap in the market is an unmet customer need or a product opportunity that existing competitors have not adequately addressed. Research might reveal that customers want a faster delivery service, a less expensive product or an easier-to-use mapping application. Filling a gap may give a business an advantage, but other firms could enter the market if they see the opportunity.
To Reduce Risk
New products are uncertain: demand can be misjudged, prices may be too high and competitors may react. Research can reduce—but cannot remove—the risk of product failure. For example, Amazon’s Fire Phone was launched in 2014 and withdrawn around a year later after disappointing sales. Even large businesses can misjudge customer needs.
To Inform Business Decisions
Research supports choices about product design, price, promotion and distribution. For instance, the example tests whether a price reduction will actually increase sales revenue. The sales forecast matters because a lower price is only successful in revenue terms if enough extra units are sold.
| Item | Before proposed price cut | After proposed price cut |
|---|---|---|
| Price per unit | US$10 | US$8 |
| Expected units sold | 1,500,000 | 1,680,000 |
| Total revenue | US$15,000,000 | US$13,440,000 |
Working: Original revenue = US$10 × 1,500,000 = US$15,000,000. New sales volume = 1,500,000 × 1.12 = 1,680,000. Forecast revenue = US$8 × 1,680,000 = US$13,440,000. The price cut would reduce revenue by US$1,560,000 (10.4%), so the business decides not to reduce the price. This is an illustration of using research before making a decision, not a guarantee that all buyers would behave as forecast.
Methods of Primary Research
Primary or field research gathers new data that did not previously exist, specifically for the business’s research question. Businesses may ask customers questions or observe their behaviour. This makes primary evidence more relevant and adaptable, but it can be expensive and time-consuming. Some firms hire a research agency to conduct the work.
Questionnaires
A questionnaire is a planned list of written questions used to record respondents’ opinions, needs or behaviour. To obtain useful data, questionnaires should mix open and closed questions, use clear language, avoid leading wording and remain short enough that customers will finish them.
- Closed questions: offer a fixed set of responses, such as yes/no or a rating from 1 to 5. They are easy to count and compare, but may not explain the reasons for an answer.
- Open questions: allow respondents to explain their views in their own words. They often give richer information, but answers take longer to analyse.
- Avoid leading questions: “How much do you love our new product?” suggests a favourable response. “What do you think of our new product?” is more neutral.
Questionnaires can be distributed by post, telephone, face-to-face interviews or online forms. Postal surveys are convenient but may have low response rates. Telephone interviews can reach a wide area but may annoy recipients. Personal interviews allow clarification but take staff time. Online surveys are often inexpensive and quick, although some people ignore invitations and respondents may not represent all consumers.
Focus Groups or Consumer Panels
In a focus group, selected customers discuss a product, service or marketing idea under the guidance of a researcher. A consumer panel may provide feedback over time. Researchers can ask follow-up questions, observe reactions and explore reasons behind preferences. However, small groups may not represent the wider population, and strong personalities can influence other members.
Observation
Researchers watch what people do, such as which supermarket displays attract attention or how long shoppers examine different products. Behavioural evidence may reveal patterns that questionnaires miss. However, watching customers may not explain why they behave in a particular way, because the observers are not asking for their reasons.
Test Marketing
Test marketing means launching a product in a limited geographical area before attempting a full national release. A business studies sales, feedback and product problems, then makes improvements if necessary. This reduces launch risk, but a small test area may be unrepresentative and competitors may learn about the new product.
Example: Manzini Safari Tours
Manzini Safari Tours operated trips around the Mlilwane Wildlife Sanctuary in Swaziland (the country is now called Eswatini). park visitor numbers fell from 21,400 in 2014 to 9,400 in 2015. A research agency conducted 1,000 telephone interviews with randomly chosen potential customers to investigate the fall.
| Question (abbreviated) | Yes | No |
|---|---|---|
| Ever been on a Manzini tour? | 7% | 93% |
| Ever been on any other safari tour? | 61% | 39% |
| Would go if the tour were cheaper? | 44% | 56% |
| Have seen Manzini adverts? | 7% | 93% |
| Would a holiday in Swaziland appeal? | 46% | 54% |
The visitor decline was 12,000 people, or approximately 56.1% of the 2014 level. Only 7% of respondents recalled seeing Manzini advertising and 44% said they might go if the price were lower. Open comments also mention cost, low destination awareness and expectations about animals. These findings could inform promotion, pricing and customer information, but the business must check whether the sample adequately represents people likely to visit.
Check your understanding · Halfway
Try each question before opening its suggested answer.
Define market research and explain two of its purposes.
Show suggested answer
Market research is the collection, presentation and analysis of information about consumers and marketing. It helps a business identify customer needs, find market gaps, reduce risk and support decisions such as pricing or product design.
Using Figure 33.2, what were the two most common ways adventure travellers prepared for trips?
Show suggested answer
69% reported researching online and 64% consulted friends and family. This suggests that tour operators should provide useful online information and encourage recommendations.
A business reduces its selling price from US$10 to US$8 and expects unit sales to rise by 12% from 1,500,000. Calculate the new revenue.
Show suggested answer
Expected sales = 1,500,000 × 1.12 = 1,680,000 units. New revenue = 1,680,000 × US$8 = US$13,440,000, which is lower than the original US$15,000,000.
Explain the difference between open and closed questions, giving one example of each.
Show suggested answer
A closed question has limited options, such as “Would you visit this park? Yes/No”. An open question allows a detailed reply, such as “What would improve your experience at this park?”.
Describe one strength and one limitation of focus groups.
Show suggested answer
They let researchers probe detailed opinions and ask follow-up questions. However, a small group may be unrepresentative, and participants may be influenced by others.
Manzini Safari Tours visitors fell from 21,400 to 9,400. Calculate the fall as a percentage of 2014 attendance.
Show suggested answer
Fall = 21,400 − 9,400 = 12,000. Percentage = 12,000 ÷ 21,400 × 100 = 56.1% (to one decimal place).
Methods of Secondary Research
Secondary or desk research uses information that has already been collected, either inside or outside the business. It is often cheaper and faster than primary research, and can help businesses understand the overall market before undertaking their own surveys. However, existing information may be old, incomplete, biased or not exactly suited to the firm’s question.
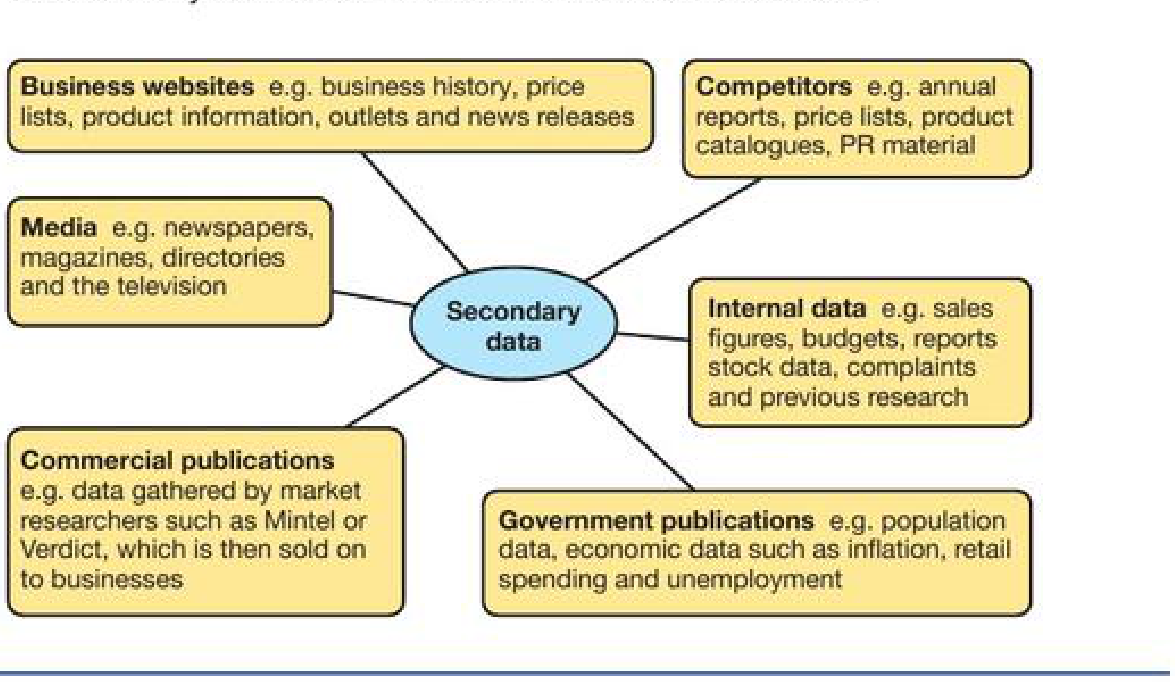
| Source | Examples | Possible use |
|---|---|---|
| Internet and business websites | Product information, prices, news releases | Compare competitors’ product features and prices |
| Internal company records | Sales, stock records, budgets, customer complaints | Identify which products sell best and recurring problems |
| Market reports and commercial research | Published industry research, market surveys | Estimate the market size or consumer trends |
| Government reports | Population, unemployment, inflation, consumer spending | Decide where to locate a shop or target a product |
| Media and competitors | News reports, catalogues, annual reports | Monitor changes in the business environment |
For example, a supermarket considering a new branch could use government population information and its own previous sales records before paying for a local customer survey. Managers should check the date, original purpose, geographical coverage and accuracy of any secondary data they rely upon.
Qualitative and Quantitative Data
Market research data can be qualitative or quantitative. These refer to the form of the information, rather than whether it is primary or secondary. A business can gather both types through surveys, interviews, observations and existing reports.
| Qualitative data | Quantitative data |
|---|---|
| “The holiday seems too expensive.” | 44% would consider going if the price were reduced. |
| “The cleaner is difficult to store.” | 35 of 50 customers chose a smaller cleaner. |
| Explains opinions and the reasons behind choices. | Measures amounts, percentages, frequency or market size. |
| Often detailed but more subjective and harder to classify. | Often easier to compare, calculate and graph, but may hide reasons. |
For Manzini Safari Tours, the percentages answering “yes” or “no” are quantitative; the customer comments about supervision and price are qualitative. Both matter: numbers help identify how widespread an issue is, while comments help explain why it may occur.
Quantitative findings can be summarised using frequencies, percentages and charts. Qualitative comments often need grouping into themes; different researchers might interpret the same comments differently. Using both types can provide a fuller picture, although neither guarantees that the sample is reliable.
Importance of the Reliability of Market Research Data
Research is useful only when the information is sufficiently reliable for the decision being made. If evidence is inaccurate, outdated or biased, the business may invest in a product nobody wants or set an unsuitable price. Research can reduce uncertainty, but human behaviour is not completely predictable.
- Sample size and representativeness: too few respondents or a sample from only one customer group may not reflect the whole market. A larger sample alone cannot solve poor selection.
- Question design: leading, confusing or overly technical questions may produce distorted answers.
- Response and interviewer bias: people may give socially desirable answers or say what they think researchers want to hear. Poorly trained interviewers can also influence responses.
- Age and quality of data: an old report may no longer describe current customer behaviour; figures from uncertain sources may be inaccurate.
- Stated intentions vs actual actions: someone saying they would buy a product does not guarantee they will actually purchase it.
A business can pilot-test questions on a small group, use neutral wording, choose a representative sample, compare results across methods and verify important claims against trustworthy up-to-date sources. Cost and time still limit how much evidence it can collect.
Large vs Small Businesses
Research is important for businesses of all sizes, but the methods, resources and risks may differ. A small shop might speak informally with regular customers, observe shopping habits and use free government statistics. Such approaches cost less and may be appropriate for local decisions, but they often involve small, unrepresentative samples.
Large businesses can afford dedicated marketing departments, research agencies, customer panels, large surveys and detailed statistical analysis. They may need research covering many regions or products, and they could lose substantial sums if they misunderstand a market. However, spending more does not automatically make findings accurate: both large and small firms must check research reliability.
| Smaller business | Larger business |
|---|---|
| May interview customers directly or use informal feedback. | Can commission specialist research and large representative samples. |
| Typically has a limited research budget. | May pay for proprietary market reports and sophisticated analytics. |
| Can respond quickly to local needs. | Can compare customer behaviour across regions and segments. |
| Risks conclusions based on very few people. | Risks overlooking local needs within large datasets. |
End-of-chapter questions
Try each question before opening its suggested answer.
Distinguish between primary and secondary research using two business examples.
Show suggested answer
Primary research collects new data for a specific question, such as interviewing 1,000 potential safari customers. Secondary research uses existing data, such as government tourist-arrival statistics or a company’s past sales records.
Explain why a questionnaire should avoid leading questions and jargon.
Show suggested answer
Leading questions encourage a particular answer and make results biased. Jargon can confuse respondents, leading to inaccurate answers or non-completion. Clear, neutral questions improve the usefulness of the responses.
Describe two advantages and two disadvantages of online surveys.
Show suggested answer
Advantages: they can be inexpensive and quick to distribute, and answers may be processed automatically. Disadvantages: some customers cannot be reached, and many recipients may ignore requests, creating non-response bias.
Explain how observation and test marketing differ. Which would be more useful before a new nationwide product launch?
Show suggested answer
Observation records existing customer behaviour; test marketing sells a new product in a limited region to measure demand and gather feedback before a broader launch. Test marketing may be more useful for estimating sales before a national rollout, though it can be costly and the trial area may be unrepresentative.
Use the Manzini survey to identify two possible reasons for declining visitor numbers.
Show suggested answer
Only 7% recalled Manzini advertising, suggesting low awareness. 44% would consider attending if it were cheaper, and comments mention high family costs, suggesting price may deter some customers. Both are possible explanations that need further testing.
Identify two internal and two external sources of secondary research data.
Show suggested answer
Internal: historical sales figures and customer complaints. External: government statistics and commercial market reports. Competitors’ catalogues or media reports could also be used.
Classify these findings as qualitative or quantitative: “The product seems reliable”, 38% prefer red, “The service is slow”, 420 units sold.
Show suggested answer
“Product seems reliable” and “service is slow” are qualitative. “38% prefer red” and “420 units sold” are quantitative.
Evaluate two benefits and one limitation of social media research for Nescafé.
Show suggested answer
It offers fast, low-cost, wide-reaching feedback, and comments may reveal detailed customer attitudes. However, online users may be unrepresentative or use false profiles, meaning the evidence may mislead managers unless checked. The reported sales and visit improvements are historical case figures.
Explain three reasons why market research may be unreliable, with a remedy for each.
Show suggested answer
(1) Biased sample: sample different representative customer groups. (2) Leading questions: pilot-test neutral wording. (3) Old or inaccurate data: verify source dates and compare with current trustworthy information. Human behaviour can still change.
A survey of 1,200 potential customers finds that 420 prefer the new product design. Calculate the percentage who prefer it and explain one sampling limitation.
Show suggested answer
420 ÷ 1,200 × 100 = 35%. The result may not represent the entire target market if the survey was biased toward one age group, region or type of customer.
Evaluate how a vehicle manufacturer should use market research before launching a new model. Recommend an appropriate mix of methods.
Show suggested answer
The firm could use focus groups and interviews to understand features customers value, online questionnaires for broader quantitative feedback, and limited test marketing to assess demand. Findings should be checked against secondary sales and competitor data. Multiple methods reduce risk but cannot guarantee success.
Chapter 33 recap
Research helps businesses understand customers, identify gaps, reduce risk and make decisions. Primary research collects new information; secondary research uses existing sources. Questionnaires, focus groups, observation and test marketing offer different strengths and limitations. Both qualitative and quantitative data matter. Social media can give rapid feedback, but research must be checked for sample bias, inaccurate answers, outdated evidence and misleading assumptions. No single method guarantees a successful business decision.
Source reference: Pearson Edexcel International GCSE Business (9–1), Chapter 33. Historical figures are included for educational illustration. IGCSE360 is an independent learning website and is not affiliated with Pearson.
Role of Social Media in Collecting Market Research Data
Businesses can collect research information by studying conversations and trends on social media platforms, blogs and online communities. They may follow product mentions, popular searches, consumer reviews and hashtags to identify emerging needs, reactions and complaints. this is often a fast and low-cost route to customer feedback, though users who post online may not represent the whole market.
Example: Nescafé
the example’s 2015 example describes Nescafé, one of Nestlé’s coffee brands, shifting its websites to the Tumblr social-media platform. The business aimed to strengthen relationships with young consumers, collect information about their attitudes and encourage interaction.
In the historical Nescafé example, sales reportedly rose by US$200,000 over six months, total monthly visits increased by 29%, and users spent 18% longer per visit. These are historical results rather than current figures. Online comments and conversations can reveal attitudes, but managers must check whether the contributors are genuine customers and representative of the intended audience.