Distinguish efficiency
Separate productive, allocative and dynamic efficiency and recognise the conditions associated with each.

Markets use prices to guide resources, but efficient production alone does not guarantee the best outcome for society. This chapter distinguishes productive, allocative and dynamic efficiency, introduces Pareto optimality, and explains why free-market equilibrium can sometimes fail to produce the socially desirable allocation of resources.
Separate productive, allocative and dynamic efficiency and recognise the conditions associated with each.
Explain why a Pareto optimum means that no reallocation can make someone better off without making someone else worse off.
Recognise when market equilibrium differs from the socially optimal allocation of resources.
Link market failure to externalities, asymmetric information, merit and demerit goods, public goods or firm dominance.
In a market economy, prices transmit information between consumers and producers. Consumer surplus indicates the benefit consumers receive above the price paid, while producer surplus represents the return producers receive above the minimum needed to keep supplying. The central question is whether self-interested choices by consumers and firms lead to an efficient allocation for society as a whole.
A society faces scarcity, so it needs to use limited resources as effectively as possible. A point inside the production possibility curve (PPC) is productively inefficient because more of at least one good could be produced without sacrificing the other. Points on the PPC use available resources fully, but choosing between different points on the frontier requires information about society's preferences.
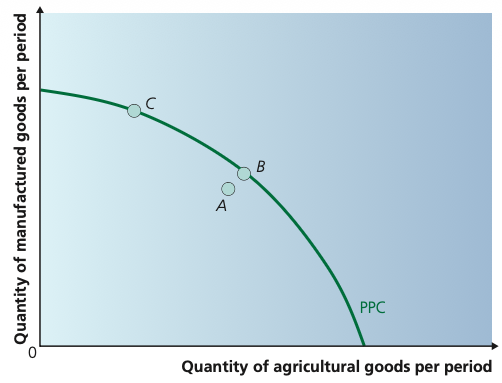
Point A lies inside the production possibility curve, so resources are not being fully or efficiently used. Points B and C lie on the frontier and are therefore productively efficient. Choosing between B and C requires information about society’s preferences, so the PPC alone cannot identify which point is allocatively efficient.
Adapted from Cambridge International AS & A Level Economics, Second Edition, by Peter Smith (with Adam Wilby and Mila Zasheva).
Are resources and inputs being used so that output is produced at the lowest possible average cost?
Is society producing the mix of goods and services that best matches consumer preferences?
Every point on a PPC can satisfy the Pareto criterion in the narrow sense that gaining more of one output requires sacrificing some of the other. However, different distributions of income and preferences can support different equilibrium points, so Pareto optimality does not by itself identify a unique socially preferred distribution.
For a firm, productive efficiency is attained when it operates at the minimum average total cost for its chosen scale of output. The textbook separates this into two linked requirements:
Produce the maximum possible output from a given set of inputs.
Choose the most appropriate combination of inputs, given their relative prices and the intended scale of output.
Economies of scale can lower long-run average cost as the scale of production rises, so the productively efficient technique may differ at different output levels.
Allocative efficiency is achieved when resources produce the combination of goods and services that matches consumer preferences. In an individual market, the key condition is that the marginal benefit from the last unit equals the marginal cost of producing it. Under the market interpretation used here, the demand curve reflects marginal benefit and the supply-side marginal unit reflects marginal cost, so the efficient condition can be expressed as P = MC.
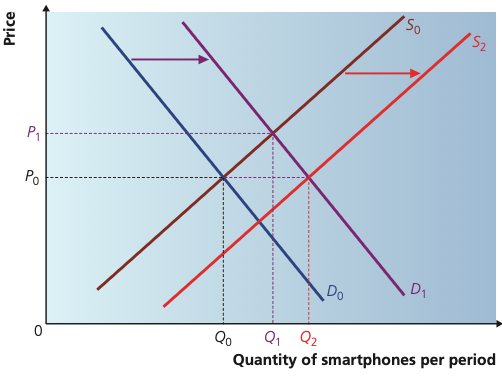
Starting from the original equilibrium, a rise in demand shifts D₀ to D₁, raising price and quantity in the short run. The resulting producer surplus attracts entry; market supply shifts from S₀ to S₂, pushing price back toward P₀ while quantity rises to Q₂. The diagram helps show how entry and exit can move a competitive market toward the condition P = MC.
Adapted from Cambridge International AS & A Level Economics, Second Edition, by Peter Smith (with Adam Wilby and Mila Zasheva).
The market process relies on firms being able to enter activities that offer attractive returns and leave activities that no longer cover opportunity costs. Resources then move toward goods whose marginal benefit justifies their marginal cost.
Productive and allocative efficiency can be viewed at a point in time. Dynamic efficiency adds the effect of innovation and technological progress over time. Research and development today may raise productivity tomorrow, while new products may improve the future mix of goods available to consumers.
Market failure occurs when the free-market equilibrium does not produce the socially optimal allocation of resources. Too much or too little of a good may be produced or consumed compared with the position that would maximise social welfare.
The additional benefit to society from consuming one more unit of a good.
The additional cost to society from producing one more unit of a good.
Some costs or benefits fall on third parties and are not reflected in market prices. Private decision-makers therefore respond to incomplete costs or benefits.
Market participants may lack full information, or one side may have better information than the other.
A dominant firm may use weak competition to charge higher prices or disadvantage consumers or suppliers.
If producers or consumers do not face all the costs created by their decisions, or do not receive all the benefits, the market price fails to communicate the full social effect of the transaction. The resulting market equilibrium can therefore differ from the social optimum. Chapter 16 develops externalities in detail.
Markets need reliable information about prices, quality and other conditions. Asymmetric information exists when some participants have better information than others. This can distort choices and prevent mutually beneficial transactions.
Doctors or dentists usually know far more than patients about what treatment is necessary. The buyer may therefore struggle to judge whether the service offered is needed or represents good value.
Students may not fully understand the long-run value of particular subjects or training. Better information and carefully designed incentives can help reduce the failure.
Sellers know more than buyers about vehicle quality. If buyers cannot distinguish reliable cars from poor-quality “lemons,” they may offer only a low price, driving good cars from the market.
One response is to improve information. In the second-hand car example, a credible warranty can signal quality and reduce buyer uncertainty.
Information failure can also lead consumers to misperceive the benefits or costs of consumption. The textbook treats this as a reason why merit goods may be underconsumed and demerit goods may be overconsumed, creating a gap between the market outcome and the socially desirable level.
May be consumed less than the government judges socially desirable because consumers underestimate benefits or lack information.
May be consumed more than the government judges socially desirable because consumers underestimate costs or risks.
Public goods have characteristics that make private market provision difficult. Because people may receive the benefit without paying, the free-rider problem removes the commercial incentive to supply the socially appropriate quantity. The relevant characteristics are non-excludability, non-rivalry and non-rejectability.
Market failure can also arise when a firm or group of firms is sufficiently dominant to act at the expense of consumers or suppliers. A lack of effective competition may allow price to be set above marginal cost, so the allocative-efficiency condition is not satisfied.
| Source of failure | Why the market outcome may be inefficient | Typical direction of the problem |
|---|---|---|
| Externality | Private prices omit third-party costs or benefits. | Too much or too little compared with the social optimum. |
| Asymmetric information | One side cannot judge quality, need or risk accurately. | Poor decisions or beneficial trades not taking place. |
| Merit / demerit goods | Consumers misperceive benefits or costs. | Merit goods underconsumed; demerit goods overconsumed. |
| Public goods | Free riders weaken the incentive for private supply. | Underprovision or no market provision. |
| Firm dominance | Weak competition allows market power to influence price and output. | Price may exceed marginal cost. |
20 questions. Each answer is marked immediately with a short explanation of why it is correct or incorrect.