Separate the four concepts
Distinguish private, external and social costs and benefits and use the correct marginal terminology.

Market prices guide private decisions, but they do not always include every cost or benefit created by production and consumption. This chapter develops the externality analysis introduced in Chapter 15, shows how private and social incentives can diverge, identifies the associated deadweight welfare loss, and explains how social cost–benefit analysis can be used when wider effects matter.
Distinguish private, external and social costs and benefits and use the correct marginal terminology.
Draw and explain positive and negative externalities in production and consumption.
Compare free-market output with the social optimum and locate the deadweight welfare loss.
Apply asymmetric information, moral hazard and social cost–benefit analysis to real economic decisions.
A private decision-maker normally considers the costs that it has to pay and the benefits that it receives. Society may experience additional effects that fall on third parties. These external costs and benefits must be added to the private values when judging whether the allocation is efficient for society as a whole.
A cost incurred directly by a firm or consumer as part of its own economic activity.
A cost created by an activity but borne by a third party and not reflected in the market price.
The full cost to society: private cost plus external cost.
The benefit received directly by the firm or consumer taking the decision.
A benefit received by a third party who is not directly involved in the transaction.
The full benefit to society: private benefit plus external benefit.
Social cost = Private cost + External cost
Social benefit = Private benefit + External benefit
At the margin: MSC = MPC + MEC and MSB = MPB + MEB.
A producer faces private costs of $75. Production creates external costs of $20. Consumers receive private benefits of $90 and third parties receive external benefits of $15.
Social cost = $75 + $20 = $95.
Social benefit = $90 + $15 = $105.
Net social benefit = $10, so social benefits exceed social costs in this example.
An externality is a cost or benefit created by an economic activity that is external to the market transaction and therefore is not fully reflected in market prices. Because decision-makers respond to private rather than full social costs and benefits, the free-market quantity can differ from the socially optimal quantity.
The external effect arises from producing the good. This changes the relationship between MPC and MSC.
The external effect arises from consuming the good. This changes the relationship between MPB and MSB.
Pollution from a factory is a standard example. The producer pays its own production costs but nearby households may bear health, cleaning or environmental costs. Therefore MSC is above MPC. Left unregulated, the market produces more than the socially optimal quantity.
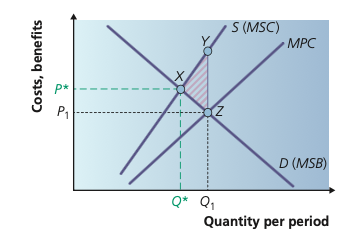
A producer bases output on marginal private cost (MPC), but pollution or another spillover imposes additional costs on third parties, so MSC lies above MPC. The market produces Q₁, which is greater than the socially efficient quantity Q*. The shaded triangle is the deadweight welfare loss.
Adapted from Cambridge International AS & A Level Economics, Second Edition, by Peter Smith (with Adam Wilby and Mila Zasheva).
Deadweight welfare loss is the loss of social welfare created because an externality moves output away from the social optimum. In an externality diagram, identify the range between the market quantity and the socially optimal quantity, then measure the gap between MSB and MSC across that range. The resulting triangle represents the lost net social benefit.
When consumption creates benefits for third parties, MSB is above MPB. Consumers choose a quantity based on their own private benefit, so the free market underconsumes the good relative to the social optimum. Examples include activities where other people enjoy a spillover benefit.
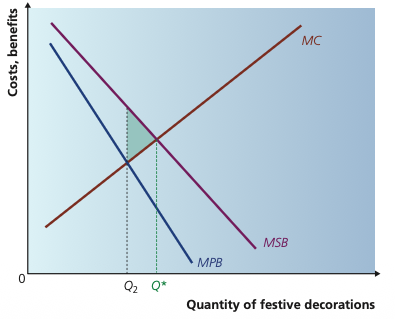
Consumers take account of their own marginal private benefit (MPB), but others also receive a benefit, so MSB lies above MPB. The market quantity Q₂ is below the socially efficient quantity Q*, meaning the good is underconsumed from society’s point of view.
Adapted from Cambridge International AS & A Level Economics, Second Edition, by Peter Smith (with Adam Wilby and Mila Zasheva).
A production activity may lower costs for another firm. For example, a producer that improves the quality of water it discharges may reduce filtration costs for a downstream business. In this case MSC is below MPC. The producer bases output on its higher private cost, so it produces too little relative to the socially optimal quantity.
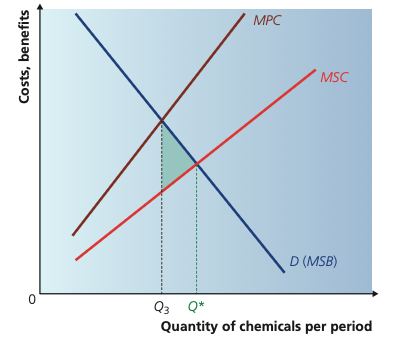
When a firm’s production creates benefits for another producer, the full social cost is lower than the firm’s private cost, so MSC lies below MPC. The private market produces Q₃, less than the socially efficient quantity Q*, creating a welfare loss from underproduction.
Adapted from Cambridge International AS & A Level Economics, Second Edition, by Peter Smith (with Adam Wilby and Mila Zasheva).
When consumption imposes costs on third parties, MSB is below MPB. The consumer takes account of private satisfaction but not the harm imposed on others, so too much is consumed in the free market.
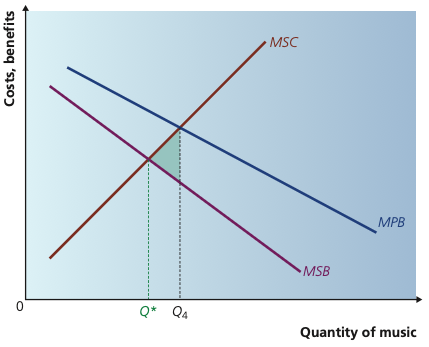
The consumer receives the private benefit shown by MPB, but consumption imposes a cost on other people, so MSB lies below MPB. The market quantity Q₄ is greater than the socially efficient quantity Q*; the good is overconsumed.
Adapted from Cambridge International AS & A Level Economics, Second Edition, by Peter Smith (with Adam Wilby and Mila Zasheva).
| Type | Relationship | Free-market problem | Typical example |
|---|---|---|---|
| Negative production | MSC > MPC | Overproduction | Industrial pollution |
| Positive production | MSC < MPC | Underproduction | An action by one producer lowers another producer's costs |
| Negative consumption | MSB < MPB | Overconsumption | Loud music disturbing neighbours |
| Positive consumption | MSB > MPB | Underconsumption | Vaccination or education spillovers |
Environmental problems frequently involve external costs. Pollution may cross borders, so the country or firm creating the damage may not face the full cost. Climate change, acid rain, smoke crossing national borders and the use of shared rivers all show why international cooperation can be required.
A related issue is weak or unclear property rights. If those harmed could charge the polluter for the damage, some of the external cost would be brought into the decision. Bringing an external effect back into the price mechanism is known as internalising the externality.
A driver considers the private cost of a journey, including fuel, time and the congestion that the driver personally experiences. But one extra vehicle can also slow every other road user. This means MSC exceeds MPC, so the number of journeys made on a congested road can exceed the socially efficient level.
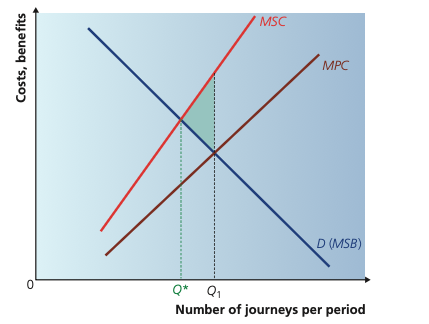
A driver considers the private cost of a journey, but an additional vehicle also delays other road users. This extra congestion cost means MSC is above MPC. The market produces Q₁ journeys, while the efficient level is lower at Q*.
Adapted from Cambridge International AS & A Level Economics, Second Edition, by Peter Smith (with Adam Wilby and Mila Zasheva).
The vaccinated person receives private protection, but vaccination also reduces the chance of infecting others. Therefore MSB can exceed MPB and the free market may provide too few vaccinations.
Individuals may gain higher lifetime earnings, but society can also gain from productivity spillovers when educated workers cooperate. These wider benefits can make MSB exceed MPB.
Roads and communications created to support tourism can reduce costs for other local firms. The benefit spills over beyond the businesses that directly paid for or demanded the infrastructure.
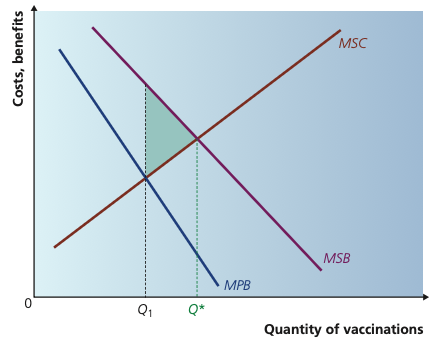
Individuals compare the private benefit of vaccination with its private cost, giving the market quantity Q₁. Vaccination also reduces the probability of infection for other people, so MSB exceeds MPB. Society therefore prefers the higher quantity Q*.
Adapted from Cambridge International AS & A Level Economics, Second Edition, by Peter Smith (with Adam Wilby and Mila Zasheva).
External effects are not the only source of distorted decision-making. In insurance markets, one side may possess better information than the other.
People at greater risk are more likely to seek insurance because they know more about their own risk than the insurer does.
After obtaining insurance, a person may take more risk because some of the consequences are transferred to the insurer.
Suppose a polluting market has the following values at 40,000 units per week: MSB = 60, MPC = 32 and MSC = 60. Because MSB = MSC, 40,000 is the socially efficient quantity. To make firms face the full social cost at that output, the per-unit tax would need to close the gap between MSC and MPC:
Tax = MSC − MPC = 60 − 32 = 28 per unit.
Large projects such as dams, airports and major roads can create effects well beyond their direct financial costs and revenues. A decision should therefore consider the full range of private and external costs and benefits and how they are distributed through time.
Social cost–benefit analysis is a structured method of evaluating a project by comparing its direct and wider social costs and benefits, including externalities.
Direct project costs such as labour, materials and construction may be easy to identify. Indirect effects may be more difficult. A dam can displace people, flood agricultural land or alter ecosystems, while also providing irrigation or hydroelectric power. A road may use valuable land and generate noise, but it may also reduce journey times and firms' transport costs.
Opportunity cost matters: using land, labour or public funds for one project means those resources cannot be used elsewhere.
Items traded in markets already have observable prices, but many externalities do not. A shadow price is an estimated monetary value used for a cost or benefit for which no suitable market price exists. Examples include the value of reduced noise, cleaner air, time saved or environmental damage.
A benefit received today is normally valued more highly than the same benefit received many years later. Social cost–benefit analysis therefore discounts future flows into present values. The choice of discount rate matters: a higher discount rate gives less weight to distant future effects, while a lower rate gives relatively more weight to future generations.
If the estimated total social benefits exceed total social costs, the project may be justified. When several projects are compared under consistent assumptions, decision-makers may examine their benefit–cost ratios. However, the final result should not be treated as completely objective because valuations and the discount rate involve judgement.
| Issue | Why it matters | Evaluation point |
|---|---|---|
| External effects | Private accounts can omit major social costs or benefits. | Some effects are difficult even to identify. |
| Shadow prices | Allow non-market effects to enter the calculation. | Valuation may be subjective. |
| Discount rate | Converts future effects into present values. | Different rates can change which project looks preferable. |
| Distribution | Costs and benefits may fall on different groups. | A positive net benefit does not mean everyone gains. |
| Long time horizon | Major infrastructure may affect several generations. | Political incentives may favour visible short-run benefits. |
20 questions. Each answer is marked immediately with a short explanation of why it is correct or incorrect.