Explain firm growth
Distinguish organic growth, diversification, mergers and the main forms of integration.

Firms can grow internally or by combining with other businesses, and their decisions need not always be driven by short-run profit maximisation. This chapter links growth, ownership and management to alternative objectives and pricing strategies.
Distinguish organic growth, diversification, mergers and the main forms of integration.
Compare profit maximisation with survival, satisficing, revenue, sales-volume and managerial objectives.
Explain price discrimination, limit pricing, predatory pricing, price leadership and price rigidity.
Link ownership, information, market structure and long-run strategy to the choices made by firms.
Firms differ greatly in size. Some activities favour large-scale production, while other markets allow small firms to remain efficient because personal service, flexibility, niche demand or limited economies of scale matter more than size.
Small firms may have low overheads, close customer relationships, flexibility and specialist niches. Owners may also value control and independence.
Growth may bring economies of scale, greater market share, more market power, access to wider markets and a stronger competitive position.
Finance may be difficult to obtain, markets may become saturated and expansion can create managerial or organisational problems.
Organic growth occurs when a firm expands from within, for example by reinvesting retained profit or using borrowing to finance additional capacity. A successful firm may increase sales, gain market share and then reinvest the resulting profits.
Organic growth can be gradual and easier to control, but it can be constrained by finance or by a saturated product market. A firm may then pursue diversification by selling its existing product in new markets or introducing new products. Diversification can reduce risk when activities do not move together, but it can also expose the firm to markets in which it lacks expertise.
External growth occurs when firms combine. A merger is usually presented as a combination of firms into one organisation, while a takeover/acquisition involves one firm obtaining control of another and can be hostile.
| Type | Meaning | Possible reasons / effects |
|---|---|---|
| Horizontal | Firms at the same stage of production in the same industry combine. | Higher market share, immediate scale economies, rationalisation and potentially greater market power. |
| Vertical backward | A firm combines with a supplier at an earlier stage of production. | Greater control over inputs, supply reliability and margins. |
| Vertical forward | A firm combines with a distributor or business at a later stage. | Greater control over distribution, access to customers and downstream margins. |
| Conglomerate | Firms operating in different markets combine. | Risk spreading and possible shared central functions, but management may lack specialist knowledge across activities. |
A cartel is an agreement between firms over price and output designed to raise their joint profits. By acting together, firms try to reproduce the outcome of a single monopoly rather than competing independently.
The central weakness of a cartel is the incentive to cheat. Once rivals restrict output, an individual member may be tempted to sell extra units and capture more market share. If several members do this, total output rises, price falls and the cartel arrangement breaks down.
Cartels are illegal in many countries because successful collusion can restrict output and raise price at consumers' expense. The textbook uses OPEC as the best-known example of cartel-like coordination, although it is an agreement among oil-producing countries rather than private firms.
Few firms, similar products, transparent market conditions and the ability to monitor rivals make agreements easier to sustain.
Many firms, secrecy, excess capacity, rapidly changing demand or products that differ strongly make cheating harder to detect or more attractive.
Successful collusion can restrict output and raise price, producing an outcome closer to monopoly than competition.
In large companies, owners often delegate daily decision-making to managers. The owners are the principals and managers are their agents. A problem arises when the objectives of the two groups differ.
Managers know more about day-to-day operations than dispersed shareholders. This asymmetric information can make it difficult for owners to judge whether managers are acting in the owners’ interests.
Managers may accept comfortable rather than maximum profit, build larger departments for status, tolerate organisational slack or allow X-inefficiency.
Owners can improve monitoring or redesign incentives. For example, remuneration linked to profit or shareholder returns can make managers' objectives more closely aligned with those of owners.
Profit maximisation remains an important benchmark, but the textbook develops several alternatives. A firm's actual behaviour may reflect ownership, management incentives, information limitations, social goals and whether managers focus on the short run or long run.
A small owner-managed firm may prefer independence and continuity to maximum profit or rapid growth, particularly when scale economies are limited.
Managers may seek a satisfactory level of profit rather than the theoretical maximum. Limited information and bounded decision-making can reinforce this behaviour.
A firm may devote resources to employees, communities or wider social goals. CSR can reflect genuine values but may also protect reputation and market position.
Under revenue maximisation, the firm chooses output where total revenue is at its maximum. With a smooth downward-sloping demand curve this occurs where MR = 0. Compared with profit maximisation, output is higher and price is lower because profit maximisation occurs where MR = MC at a positive marginal revenue.
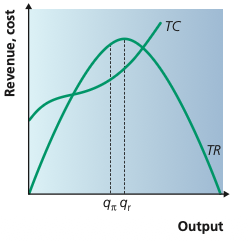
Profit is maximised where the vertical gap between total revenue and total cost is greatest, at qπ. Sales revenue is maximised further to the right at qr, where total revenue reaches its peak and marginal revenue is zero.
Adapted from Cambridge International AS & A Level Economics, Second Edition, by Peter Smith (with Adam Wilby and Mila Zasheva).
A firm focused on the number of units sold may expand output further, potentially up to the point where it just breaks even. In economic terms, break-even means TR = TC, with total cost including normal profit.
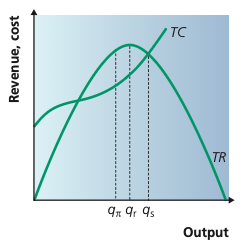
A sales-volume maximiser expands beyond both the profit-maximising and revenue-maximising outputs. It can continue up to qs, where total revenue just covers total cost, including normal profit, so the firm is at its break-even output.
Adapted from Cambridge International AS & A Level Economics, Second Edition, by Peter Smith (with Adam Wilby and Mila Zasheva).
Managers may value status, discretionary spending, staff numbers, office quality or other benefits attached to running a larger organisation. Pursuing these benefits can move the firm away from the output that maximises profit and may create X-inefficiency.
A firm may sacrifice current profit to improve future profit. Investment, temporarily lower prices, customer loyalty and entry deterrence can all make a lower short-run profit consistent with a long-run profit objective.
Price discrimination occurs when one firm charges different prices for the same product to different consumers or groups, and the price differences are not simply explained by corresponding cost differences.
The firm charges each buyer the maximum they are willing to pay. Consumer surplus can be converted into producer surplus.
The unit price varies with the quantity bought, such as a lower average price for a larger purchase.
Different identifiable groups pay different prices, such as student, senior or peak/off-peak fares.
Market power: a price-taking firm cannot choose different prices.
Information: the seller must be able to distinguish consumers or groups with different willingness to pay or different price elasticities.
Limited resale: consumers paying the lower price must not be able to resell easily to consumers facing the higher price; otherwise arbitrage undermines the price difference.
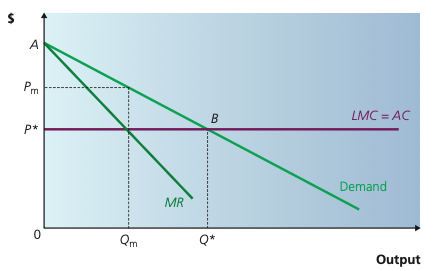
Under perfect (first-degree) price discrimination, the monopolist charges each buyer the maximum they are willing to pay for each unit. The demand curve therefore becomes the marginal-revenue schedule for successive units, output can expand to the allocatively efficient quantity where demand equals marginal cost, and consumer surplus is transferred to the firm.
Adapted from Cambridge International AS & A Level Economics, Second Edition, by Peter Smith (with Adam Wilby and Mila Zasheva).
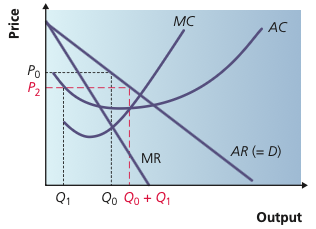
With second-degree price discrimination, buyers pay different prices for different quantities or blocks. The seller charges a higher price for earlier units and a lower price for extra units, expanding total sales to Q0 + Q1.
Adapted from Cambridge International AS & A Level Economics, Second Edition, by Peter Smith (with Adam Wilby and Mila Zasheva).
With third-degree discrimination, the firm can reallocate sales between market segments. Profit rises when output is shifted toward the segment with the higher marginal revenue until marginal revenue is equalised across segments and equals marginal cost for the total output.
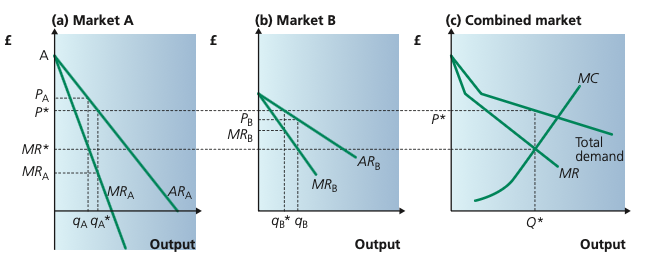
The monopolist separates consumers into markets with different demand conditions. It reallocates sales until marginal revenue is equal in both markets and equal to marginal cost for total output; the market with less elastic demand normally faces the higher price.
Adapted from Cambridge International AS & A Level Economics, Second Edition, by Peter Smith (with Adam Wilby and Mila Zasheva).
Limit pricing means setting price below the short-run profit-maximising level so that entry becomes unattractive. The incumbent may have economies of scale, learning-by-doing or another cost advantage that a small new entrant cannot immediately match.
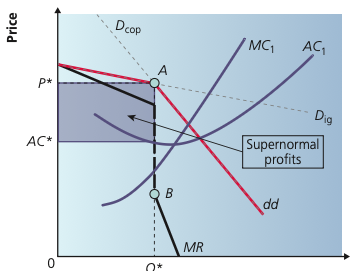
A firm with a cost advantage may deliberately charge below its short-run profit-maximising price. By keeping the market price low enough that a new entrant could not cover its costs, the incumbent sacrifices some current profit to protect its market position in the longer run.
Adapted from Cambridge International AS & A Level Economics, Second Edition, by Peter Smith (with Adam Wilby and Mila Zasheva).
Predatory pricing is much more aggressive: the firm deliberately prices so low that it accepts losses in an attempt to force rivals out or prevent them surviving. The textbook uses pricing below average variable cost as the economic benchmark associated with the Areeda–Turner approach.
Entry deterrence; price is below the profit-maximising level but the incumbent can still earn profit.
Rival elimination; the firm may deliberately endure losses in the hope of later recovering them after competition has weakened.
Oligopolists may coordinate without an explicit cartel. Under dominant-firm price leadership, a leading firm changes price and smaller firms follow. Under barometric price leadership, a firm tests a price change and others decide whether to follow, creating tacit coordination.
The kinked-demand model explains price rigidity in oligopoly by focusing on rival reactions. A firm may believe that rivals will ignore a price rise, making demand relatively elastic above the current price, but match a price cut, making demand relatively inelastic below it.
| Possible price change | Expected rival reaction | Effect on the firm's demand |
|---|---|---|
| Price rises | Rivals are expected not to follow. | The firm loses many customers, so demand is relatively elastic above the current price. |
| Price falls | Rivals are expected to match the cut. | The firm gains relatively few customers, so demand is relatively inelastic below the current price. |
Joining these two perceived demand segments creates a kink at the current price and a corresponding gap in the marginal-revenue curve. If marginal cost changes but still passes through that MR gap, the profit-maximising output and price do not change. The model therefore explains price rigidity in oligopoly.
20 questions. Each answer is marked immediately with a short explanation of why it is correct or incorrect.