Diagnose growth
Distinguish actual from potential growth and identify positive and negative output gaps using AD/AS analysis.

This chapter extends the earlier study of economic growth by separating actual from potential growth, analysing output gaps and the business cycle, evaluating policies that raise productive capacity, and asking whether growth is inclusive and environmentally sustainable.
Distinguish actual from potential growth and identify positive and negative output gaps using AD/AS analysis.
Explain recession, recovery, boom, peak and slowdown, and show how automatic stabilisers moderate fluctuations.
Assess supply-side strategies, institutional conditions, the Washington Consensus and policies aimed at inclusive growth.
Explain the environment's resource, amenity and waste-absorption functions and evaluate the conflict between growth and environmental protection.
Actual economic growth is the observed increase in real GDP or real GNI. Potential economic growth is an increase in the economy's productive capacity — the level of real output that could be produced when resources are effectively used at full employment.
If firms bring idle workers and machines back into use after a recession, actual GDP can rise without productive capacity increasing. By contrast, more capital, improved skills or better technology raises the economy's potential output.
Real GDP rises. This can occur because previously idle resources are brought back into use, so the economy moves closer to its existing capacity.
The economy's capacity itself rises, for example through more capital, better technology, higher labour productivity or an expanded effective workforce. On AD/AS diagrams this is represented by a rightward shift of LRAS.
The output gap is the difference between actual real GDP and potential real GDP.
Actual real GDP is below potential GDP. There is unused capacity: unemployment may be above its full-employment level and some capital may be idle.
Actual real GDP is temporarily above the sustainable full-employment level. Firms may be stretching capacity through overtime or unusually intensive use of capital. This cannot persist indefinitely.
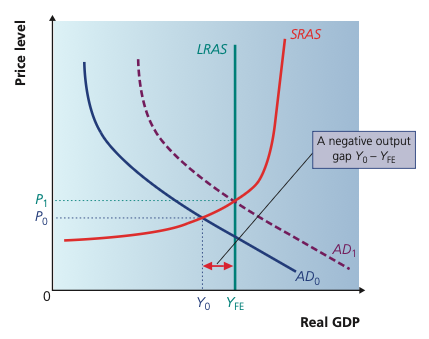
Actual real GDP is Y0, below the full-employment level YFE. The horizontal distance between them is the negative output gap, showing unused capacity and unemployment.
Adapted from the Cambridge International AS & A Level Economics book by Peter Smith (Second Edition, with Adam Wilby and Mila Zasheva).
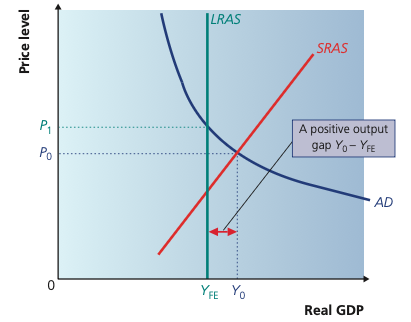
Actual real GDP Y0 is temporarily above YFE. The economy is operating beyond its sustainable capacity, for example through overtime, so cost and inflationary pressure is likely to emerge.
Adapted from the Cambridge International AS & A Level Economics book by Peter Smith (Second Edition, with Adam Wilby and Mila Zasheva).
The business cycle is the fluctuation of actual real GDP around its underlying trend over time. Growth is therefore rarely smooth.
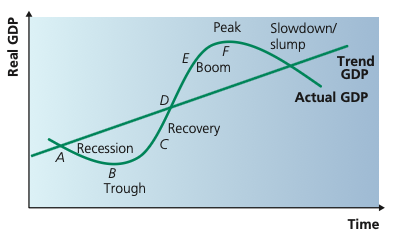
Actual GDP fluctuates around trend GDP, passing through recession, trough, recovery, boom, peak and slowdown. Output can therefore be below or above its trend level at different stages of the cycle.
Adapted from the Cambridge International AS & A Level Economics book by Peter Smith (Second Edition, with Adam Wilby and Mila Zasheva).
Changes in technology, investment, consumer demand and expectations can start expansions or contractions. The multiplier and accelerator can reinforce these movements: rising demand can encourage investment and further spending, while weakening demand can produce the reverse.
A technological breakthrough can encourage firms to invest and consumers to spend, starting an expansion. As capacity becomes stretched and confidence later weakens, investment and spending can slow; multiplier and accelerator effects can then reinforce the downturn.
Automatic stabilisers are changes in government expenditure and revenue that occur automatically as the economy moves through the cycle, without a new discretionary policy decision.
Unemployment and other benefit payments rise, while income-tax and sales-tax receipts fall. The budget moves toward deficit, partly supporting aggregate demand.
Benefit spending tends to fall and tax receipts rise. The budget moves toward surplus, which automatically withdraws some demand from the economy.
Their main advantages are speed and low administrative delay: they begin to operate as economic activity changes, rather than waiting for policymakers to recognise the problem, design a response and implement it.
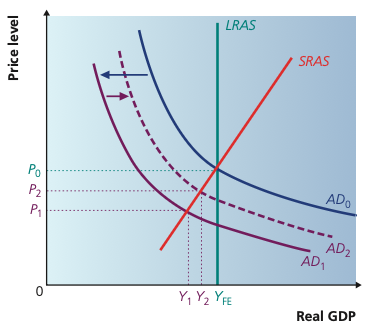
A fall in AD from AD0 to AD1 reduces output. Higher benefit payments and lower tax receipts automatically support spending, partly offsetting the fall in demand towards AD2.
Adapted from the Cambridge International AS & A Level Economics book by Peter Smith (Second Edition, with Adam Wilby and Mila Zasheva).
The textbook identifies two broad sources of long-run growth: more or better factor inputs and greater efficiency in using them. Policies therefore aim to shift LRAS to the right.
Encourage business investment by maintaining macroeconomic stability, access to credit and confidence about future demand.
Education, training and retraining can raise productivity and help workers move into expanding industries and occupations.
Transport, communications and R&D can reduce costs, improve connectivity and support technological progress.
A stable macroeconomic environment is part of this process. When inflation is controlled and firms can obtain credit, they can plan investment with greater confidence. Growth policy is therefore not isolated from fiscal and monetary policy: stability can support the private investment that adds to the capital stock.
A successful increase in productive capacity shifts LRAS to the right. The economy can then sustain a higher level of real GDP, and a given level of aggregate demand places less upward pressure on prices.
Adapted from the Cambridge International AS & A Level Economics book by Peter Smith (Second Edition, with Adam Wilby and Mila Zasheva).
The textbook presents the Washington Consensus as a set of ten policy ideas associated with promoting growth and development:
The effectiveness of these measures depends on institutions and functioning markets. Some less developed countries may have weak or incomplete financial markets, poor governance, insufficient administrative capacity, weak infrastructure or vulnerability to exploitation when markets are opened. Strong institutions, social safety nets and targeted poverty reduction may therefore be necessary alongside market reforms.
Inclusive growth is growth whose benefits are distributed more widely and that creates opportunities across society, rather than concentrating gains in a small group.
Sustainable development means meeting present needs without undermining the ability of future generations to meet their own needs. The central question is whether today's growth reduces the environmental capital available to the future.
The environment supplies natural resources and energy inputs used by firms, including both renewable and non-renewable sources.
Clean air, beaches, forests, parks and attractive landscapes contribute directly to household utility and quality of life.
Production and consumption generate waste. The environment receives and processes some of it, but its absorptive capacity is limited.
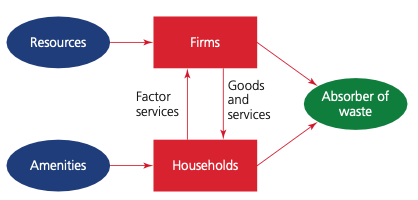
The environment supplies resources to firms and amenities to households, while also acting as an absorber of waste created by production and consumption. Sustainable growth requires all three functions to be protected.
Adapted from the Cambridge International AS & A Level Economics book by Peter Smith (Second Edition, with Adam Wilby and Mila Zasheva).
Rapid industrialisation can increase energy demand, pollution, greenhouse-gas emissions, deforestation and pressure on natural resources. These are often negative externalities because producers and consumers do not bear all the social costs. When environmental effects cross national borders, unilateral policy is less effective and international cooperation becomes important.
The chapter uses rapidly industrialising economies such as China and India to illustrate the tension. Faster growth can reduce poverty and raise living standards, but it can also increase energy use and emissions. The policy problem is therefore not simply “growth or no growth”, but how to make growth compatible with environmental sustainability.
For poorer economies, growth can be essential to reduce poverty and improve health, education and living standards. Yet industrialisation can increase environmental damage. This creates a difficult intergenerational and international trade-off: slowing growth may protect environmental capital, but can delay urgently needed improvements in current living standards.
20 questions. Each answer is marked immediately with a short explanation of why it is correct or incorrect.