Calculate
Use percentage changes correctly to calculate PED, YED, XED and PES.

Elasticity measures how strongly demand or supply responds when an economic influence changes. This chapter develops four measures — PED, YED, XED and PES — and shows how firms and governments can use them in decision making.
Use percentage changes correctly to calculate PED, YED, XED and PES.
Distinguish elastic, inelastic, unitary, perfectly elastic and perfectly inelastic responses.
Explain what the sign and size of an elasticity coefficient mean in context.
Use elasticity to analyse pricing, revenue, changing incomes, related goods and supply responsiveness.
A normal demand curve slopes downwards, so price and quantity demanded move in opposite directions. PED is therefore normally negative. In many discussions economists focus on the absolute size of PED, but in calculations you should keep the negative sign unless instructed otherwise.
| PED value | Classification | Meaning |
|---|---|---|
| 0 | Perfectly inelastic | Quantity demanded does not respond to price. |
| Between 0 and −1 | Inelastic | Quantity demanded changes proportionately less than price. |
| −1 | Unitary elastic | Quantity demanded changes by the same percentage as price. |
| Less than −1 | Elastic | Quantity demanded changes proportionately more than price. |
| Approaches −∞ | Perfectly elastic | A tiny price rise would reduce quantity demanded to zero at the market price shown. |
For a straight downward-sloping demand curve, demand is relatively elastic near the upper part, unit elastic at the midpoint and relatively inelastic near the lower part. This happens because elasticity depends on percentage changes, not simply on the slope of the line.
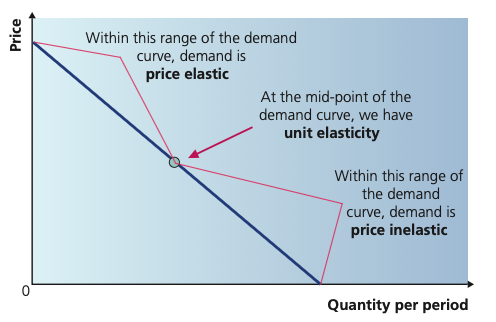
Along a straight-line demand curve, demand is price elastic at the upper part of the curve, unit elastic at the midpoint and price inelastic at the lower part. This happens because elasticity is based on percentage changes, not simply on the slope of the line.
Adapted from Cambridge International AS & A Level Economics, Second Edition, by Peter Smith (with Adam Wilby and Mila Zasheva).
Total revenue (TR) is price × quantity sold. Because the response of quantity demanded differs according to PED, the effect of a price change on revenue also differs.
| PED | If price rises | If price falls | Reason |
|---|---|---|---|
| Elastic | TR falls | TR rises | Quantity changes by a larger percentage than price. |
| Unit elastic | TR unchanged | TR unchanged | The percentage effects offset each other. |
| Inelastic | TR rises | TR falls | Quantity changes by a smaller percentage than price. |
More and closer substitutes make switching easier, so demand tends to be more elastic.
Necessities tend to be more inelastic; luxuries tend to be more elastic.
Goods taking a large share of income tend to attract a stronger response to price changes.
Demand often becomes more elastic in the long run because consumers have more time to adjust.
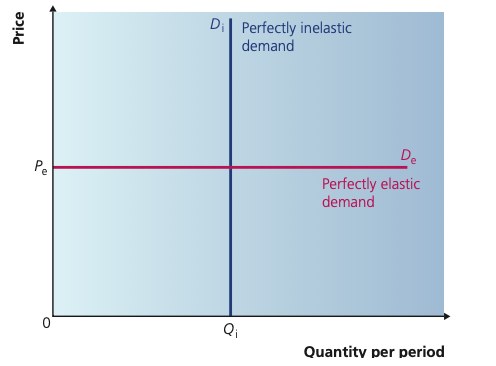
A vertical demand curve is perfectly inelastic: quantity demanded does not change when price changes, so PED is zero. A horizontal demand curve is perfectly elastic: at the stated price buyers will purchase the available quantity, but a price rise above that level causes demand to fall to zero.
Adapted from Cambridge International AS & A Level Economics, Second Edition, by Peter Smith (with Adam Wilby and Mila Zasheva).
Unlike PED, YED can be positive or negative. The sign tells you whether a good is normal or inferior, while the size tells you how strongly demand responds to income.
| YED value | Classification | Interpretation |
|---|---|---|
| Below −1 | Elastic inferior good | Demand falls proportionately more than income rises. |
| Between −1 and 0 | Inelastic inferior good | Demand falls, but proportionately less than income rises. |
| 0 | No income relationship | Demand does not respond to income. |
| Between 0 and 1 | Inelastic normal good | Demand rises by a smaller percentage than income; often associated with necessities. |
| Above 1 | Elastic normal good | Demand rises proportionately more than income; often associated with luxury-type purchases. |
XED is especially useful for identifying relationships between products. The sign indicates the type of relationship and the magnitude indicates its strength.
| XED | Relationship | What it means |
|---|---|---|
| Positive | Substitutes | A rise in the price of Y raises demand for X. A larger positive value suggests closer substitutes. |
| Negative | Complements | A rise in the price of Y reduces demand for X. A larger absolute negative value suggests a stronger complementary relationship. |
| Zero | Unrelated goods | A change in the price of Y has no measured effect on demand for X. |
Because the basic supply curve slopes upwards, price and quantity supplied normally move in the same direction. PES is therefore normally positive.
| PES value | Classification | Meaning |
|---|---|---|
| 0 | Perfectly inelastic supply | The quantity available is fixed. |
| Between 0 and 1 | Inelastic supply | Quantity supplied changes proportionately less than price. |
| 1 | Unitary elastic supply | Quantity supplied changes by the same percentage as price. |
| Above 1 | Elastic supply | Quantity supplied changes proportionately more than price. |
| ∞ | Perfectly elastic supply | Firms are willing to supply any amount at the going price. |
Supply is usually more elastic in the long run because firms have more time to adjust plant, machinery and production plans.
A firm near full capacity may find it difficult to raise output quickly, making short-run supply less elastic.
Availability of labour, machinery and raw materials affects how easily production can expand.
Storage also matters in some markets. If a product is highly perishable, firms may have little ability to hold it back or increase available supply immediately, making short-run supply less responsive.
Elasticity measures help economic decision-makers estimate how buyers and sellers may react when market conditions change. Their value lies in turning a qualitative idea — “demand may change” — into a measure of expected responsiveness.
| Measure | Useful to firms | Useful to government / policy |
|---|---|---|
| PED | Helps assess how a price change may affect sales and total revenue. | Helps estimate how demand and possible tax revenue may respond to indirect taxes or price-changing policies. |
| YED | Helps forecast demand during economic growth or recession and identify whether a product is normal or inferior. | Can help anticipate how changing household incomes may alter spending patterns. |
| XED | Helps identify close competitors, substitutes and complementary products when setting strategy. | Can help assess wider effects when policy changes the price of one product that is linked to others. |
| PES | Shows how easily output can be expanded when market prices rise. | Helps judge whether producers can respond quickly to incentives intended to increase supply. |
20 questions. Each answer is marked immediately with a short explanation of why it is correct or incorrect.