Explain intervention
Show why public goods, information failure and socially unacceptable market outcomes may lead governments to intervene.

Markets can coordinate resources through prices, but they do not always produce outcomes that governments consider efficient or socially desirable. This chapter explains why governments intervene, the main intervention tools they use, and how policies can influence prices, output, inequality and the distribution of resources.
Show why public goods, information failure and socially unacceptable market outcomes may lead governments to intervene.
Use demand and supply diagrams to explain specific indirect taxes, subsidies, minimum prices and maximum prices.
Explain why elasticity, administration costs, incentives and unintended consequences matter when evaluating intervention.
Distinguish income from wealth, interpret the Gini coefficient, and explain policies used to redistribute income and wealth.
For a mixed economy to work effectively, government first provides the framework within which markets operate. This includes political stability and secure property rights, so households and firms can make decisions with confidence. Government may intervene more actively when free-market outcomes do not allocate resources effectively or are considered socially unacceptable.
A private firm may be unable to charge every user of a pure public good. If people expect to receive the benefit whether or not they pay, the firm may be unable to earn enough revenue to make provision profitable. Important services such as street lighting or national defence may therefore require government action to ensure provision.
Consumers underestimate the benefits, so the good tends to be under-consumed in a free market. Education and vaccination are common examples.
Consumers underestimate costs or overvalue benefits, so the good tends to be over-consumed. Tobacco is a common example.
The central problem is information failure. If consumers do not fully understand the long-run consequences of their choices, too few resources may go to merit goods and too many to demerit goods. Government may intervene to change prices, provide the good, or improve information.
Government may also regard a market price as too high or too low. High rents may make housing unaffordable for low-income households, while very low agricultural prices may leave farmers with inadequate incomes. These concerns can lead to maximum or minimum price controls.
A specific indirect tax raises the cost associated with supplying each unit. Firms are therefore willing to supply less at every market price. The supply curve shifts vertically upwards/left by the amount of the tax. The new equilibrium normally has a higher price paid by consumers and a lower quantity traded.
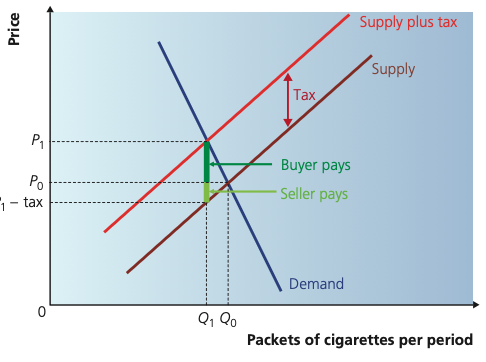
A specific tax shifts the supply curve vertically upwards by the amount of the tax. The market quantity falls from Q₀ to Q₁. Consumers pay P₁, while producers receive P₁ − tax; the gap between these two prices is the tax per unit. Because the consumer price rises by less than the full tax, the burden is shared between buyers and sellers.
Adapted from Cambridge International AS & A Level Economics, Second Edition, by Peter Smith (with Adam Wilby and Mila Zasheva).
The seller may physically pay the tax to government, but that does not mean the seller bears all of its economic burden. Part can be passed to consumers through a higher market price.
| Demand condition | Likely incidence in the chapter's limiting case | Reason |
|---|---|---|
| Perfectly inelastic demand | Buyers bear the whole tax | Quantity demanded does not respond to price, so the tax can be passed on through price. |
| Perfectly elastic demand | Sellers bear the whole tax | A price rise would cause demand to fall to zero, so sellers cannot pass the tax on. |
| Normal case | Burden is shared | Price rises by less than the full tax, so consumers and producers each bear part. |
A subsidy works like a negative indirect tax. It reduces the effective cost of production and shifts supply down/right. The equilibrium price paid by consumers falls and the quantity traded rises. The benefit is shared between consumers and producers.
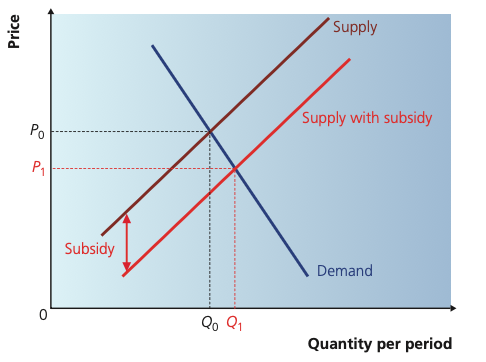
A subsidy reduces the effective cost of supplying the good, shifting supply downwards/right. The price paid by consumers falls from P₀ to P₁, while the quantity traded increases from Q₀ to Q₁. The gain from the subsidy is shared between consumers and producers.
Adapted from Cambridge International AS & A Level Economics, Second Edition, by Peter Smith (with Adam Wilby and Mila Zasheva).
The effect of a subsidy depends on responsiveness. If demand is very inelastic, a lower price may generate only a small increase in consumption. If firms cannot expand output easily, an inelastic supply response can also limit the increase in production.
Government may ensure that important public or merit goods are provided. This does not always mean the government must produce them itself: it can raise funds through taxation and contract a private organisation or local authority to provide the service.
Ensures provision where the free-rider problem or information failure would otherwise cause under-provision.
Policies must be organised, monitored and enforced, using scarce resources.
The marginal benefit from intervention should be weighed against the marginal cost of implementing and monitoring it.
If a minimum wage is set above the competitive equilibrium wage, firms demand less labour while more workers offer their labour. The result is excess supply of labour: unemployment. A minimum wage set below the equilibrium wage is non-binding and does not alter the market outcome.
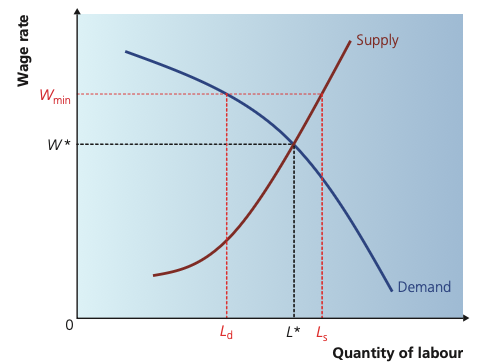
Without intervention, the labour market clears at W* and L*. A minimum wage at Wmin, set above equilibrium, reduces labour demanded to Ld and increases labour supplied to Ls. The gap Ls − Ld is excess supply of labour, shown as unemployment in the competitive-market model.
Adapted from Cambridge International AS & A Level Economics, Second Edition, by Peter Smith (with Adam Wilby and Mila Zasheva).
A government may impose a maximum price below equilibrium to make an essential good more affordable. In a rental market, a binding rent ceiling reduces the rent landlords can charge. Quantity supplied falls while quantity demanded rises, creating excess demand.
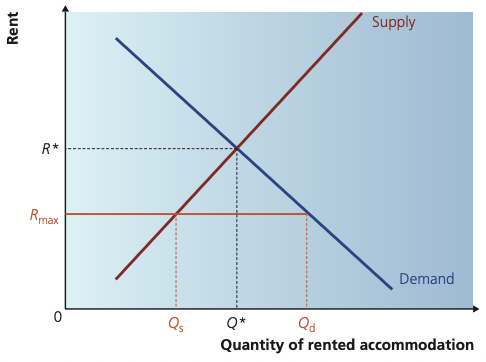
The free-market rent is R*. A maximum rent at Rmax, set below equilibrium, makes rented accommodation cheaper but reduces the quantity landlords supply to Qs while increasing quantity demanded to Qd. The result is a shortage of Qd − Qs.
Adapted from Cambridge International AS & A Level Economics, Second Edition, by Peter Smith (with Adam Wilby and Mila Zasheva).
Price controls can create rationing problems, unofficial markets, losses for suppliers who cannot sell at a controlled price, and administrative costs. The intended objective may therefore be only partly achieved.
Agricultural supply can vary sharply because of weather, disease and harvest conditions. Large price fluctuations make producers' future income uncertain and can discourage investment. A buffer stock authority sets a target price and intervenes in the market.
Where the underlying problem is information failure, government can try to improve consumers' knowledge. Campaigns about the health effects of smoking may reduce demand for a demerit good, while accurate information about vaccination may encourage consumption of a merit good. Effectiveness depends on whether people trust and act on the information; habits and addiction may weaken the response.
| Policy | Typical purpose | Main market effect / issue |
|---|---|---|
| Specific indirect tax | Discourage a demerit good | Supply shifts left/up; price rises and quantity falls. |
| Subsidy | Encourage production/consumption | Supply shifts right/down; price falls and quantity rises. |
| Direct provision | Ensure access to public or merit goods | Can overcome under-provision but creates fiscal and administrative costs. |
| Minimum price | Raise a price regarded as too low | If above equilibrium, can create excess supply. |
| Maximum price | Lower a price regarded as too high | If below equilibrium, can create excess demand. |
| Buffer stock | Stabilise volatile commodity prices | Authority buys in surplus periods and sells from stocks in shortage periods. |
| Information | Correct information failure | Attempts to change preferences and consumption decisions. |
A flow of wages, salaries and earnings from other sources received over a period of time.
A stock of accumulated assets, such as property and financial assets, owned at a point in time.
Income and wealth are linked but not identical. Saving part of income can build wealth, while wealth itself can generate income through rent, interest or dividends. Wealth may also be inherited, so differences in asset ownership can persist across generations.
Households can be ranked from lowest to highest income and divided into equal-sized groups. Comparing the shares of total income received by these groups reveals how unevenly income is distributed.
| Grouping | Population divided into | Example |
|---|---|---|
| Deciles | 10 equal groups | The first decile is the poorest 10%; the top decile is the richest 10%. |
| Quintiles | 5 equal groups | The first quintile is the poorest 20%. |
| Quartiles | 4 equal groups | The first quartile is the poorest 25%. |
The Gini coefficient allows comparisons between countries and over time. It summarises the overall distribution rather than focusing only on the richest and poorest groups. It is also commonly referred to as the Gini index.
Different skills, qualifications, occupations and sectors attract different wages. Technological change can raise demand for skilled labour and widen wage differences.
Assets are unevenly owned. Wealth can be inherited, and assets can generate further income through rents and profits.
An ageing population can increase the proportion of people dependent on pensions while reducing the share of working-age contributors.
Changes in the strength of trade unions may also affect wage inequality. A decline in union power may reduce the bargaining protection available to some lower-paid workers, although greater labour-market flexibility may bring other benefits.
A minimum wage can raise earnings for low-paid workers who remain employed. Its overall effect on inequality is uncertain if employment falls, if the legal minimum does not cover informal work, or if many workers already earn above the minimum.
Transfers may be cash benefits or benefits in kind, including access to services such as health and education. They aim to protect households whose market income would otherwise be very low.
Higher-income groups face a higher marginal tax rate. Examples of direct taxes include income tax and taxes on profits or gains.
Taxes on spending can take a larger proportion of the income of poorer households, so their effect can be regressive.
Taxes on property, capital gains or inheritance can also influence the distribution of wealth, depending on the design of the tax system.
Government may provide, finance or arrange access to essential services such as health and education. This can support lower-income households even when their cash income remains low. The exact method differs between countries and may involve public or private providers.
20 questions. Each answer is marked immediately with a short explanation of why it is correct or incorrect.