Measure activity
Explain the expenditure, income and output approaches to measuring GDP and why they should give the same total in principle.

National income statistics provide a way to measure economic activity across an entire economy. This chapter explains GDP and related measures, how to distinguish nominal from real values, and how income, output and expenditure circulate between households, firms, government and the rest of the world.
Explain the expenditure, income and output approaches to measuring GDP and why they should give the same total in principle.
Distinguish GDP, GNI and NNI, and move correctly between basic and market prices and between gross and net values.
Separate nominal changes from real changes and use a price index to convert current-price GDP into constant-price GDP.
Identify injections and leakages and explain macroeconomic equilibrium when planned injections equal planned leakages.
An economy produces many different goods and services, measured in different physical units. To combine them into one total, economists use their money value. A central measure is gross domestic product (GDP).
GDP is a measure of economic activity taking place within the country's territory. It is not the same as the income ultimately available to the country's residents, because income can flow between countries.
Add spending on domestically produced output: household consumption, firms' investment, government spending and net exports.
Add factor incomes generated by production, including wages and salaries, profits, rent and interest.
Add the value of output produced, using value added at each stage so that intermediate production is not double counted.
In principle, the expenditure, income and output approaches should produce the same total because the value of output produced creates an equal flow of income and an equal amount of expenditure. In practice, statistical measurement is not perfectly exact.
Measured using prices current at the time. A rise can therefore reflect higher output, higher prices, or both.
Adjusted for changes in the price level, allowing changes in the actual volume of production to be compared over time.
When prices rise, nominal GDP can grow even if the quantity of output changes very little. Real GDP is therefore the appropriate measure when the aim is to compare production over time.
GDP focuses on production taking place inside the economy. GNI adjusts this for income flows between residents and the rest of the world. For example, income earned abroad by residents adds to GNI, while income generated domestically but flowing to non-residents works in the opposite direction.
When the output approach is used, value added is naturally measured at basic prices. These exclude taxes on products but include subsidies. Expenditure is valued at the prices actually paid in markets, so GDP by expenditure is measured at market prices.
Used for valuing gross value added; they exclude taxes on products and include subsidies.
The prices paid in markets; they include taxes on products net of subsidies.
Gross measures include the production needed to replace worn-out capital. Net measures deduct depreciation to show the amount remaining after allowing for this loss in capital value.
Begin with an economy containing only households and firms, with no government and no international trade. Households own and supply factors of production to firms. Firms use these factors to produce goods and services.
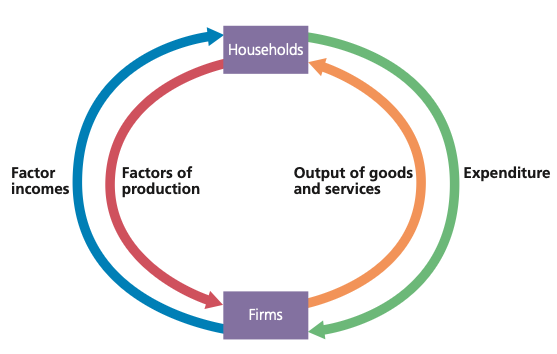
In the simple closed-economy model, households supply factors of production to firms and receive factor incomes in return. Firms supply goods and services to households, while household expenditure flows back to firms. The same activity can therefore be viewed as income, output or expenditure.
Adapted from Cambridge International AS & A Level Economics, Second Edition, by Peter Smith (with Adam Wilby and Mila Zasheva).
Firms pay households factor incomes such as wages, rent, interest and profits. Households spend income on goods and services produced by firms. In this simple closed system, income, output and expenditure are different ways of measuring the same circular flow.
A real economy also contains government and trades with the rest of the world. Some spending enters the circular flow from outside the household-consumption stream, while some income leaves it.
Money entering the circular flow through investment (I), government expenditure (G) and exports (X).
Money leaving the circular flow through savings (S), taxation (T) and imports (M).
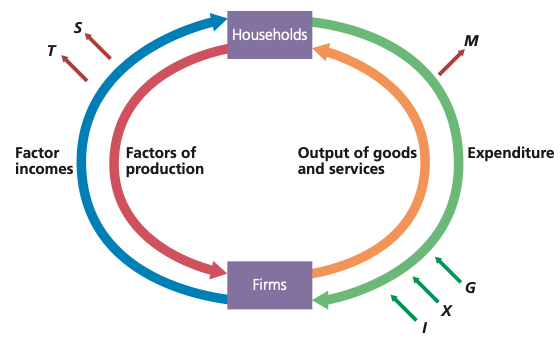
Saving (S), taxation (T) and imports (M) are leakages because they remove spending from the domestic circular flow. Investment (I), government expenditure (G) and exports (X) are injections because they add spending. Planned macroeconomic equilibrium occurs when total injections equal total leakages.
Adapted from Cambridge International AS & A Level Economics, Second Edition, by Peter Smith (with Adam Wilby and Mila Zasheva).
In macroeconomics, investment means firms' expenditure on capital goods such as machinery, equipment and buildings that add to productive capacity. Putting money into a bank account is saving, not investment in this sense.
If planned injections exceed planned leakages, total spending in the economy rises and national income tends to increase. As income increases, households are likely to save more, pay more tax and spend more on imports. These leakages rise until the circular flow moves back towards equilibrium.
If planned leakages exceed planned injections, spending and national income tend to fall. Lower income then tends to reduce saving, taxation and import expenditure, helping restore equality between injections and leakages.
Investment is an injection into current expenditure, but it also increases the economy's productive capacity by adding to the capital stock. Higher investment can therefore affect both current national income and the economy's potential for future growth. Additional investment spending may also generate further rounds of income and expenditure as firms hire workers and those workers spend part of their incomes.
20 questions. Each answer is marked immediately with a short explanation of why it is correct or incorrect.