
Chapter 28 · Break-even Analysis
Calculate the output needed to cover costs, read and construct break-even charts, and assess what happens when selling prices and production costs change.
Learning objectives
- Understand the break-even concept and calculate break-even output.
- Interpret and construct break-even charts, including margin of safety.
- Explain the effects of price and cost changes and the limitations of charts.
The Concept of Break Even
A business must generate enough sales revenue to cover the cost of producing and selling its goods or services. If total revenue is below total costs, it makes a loss; if revenue is greater, it makes a profit. When revenue and costs are equal, it has reached its break-even point. At this output there is neither a profit nor a loss.
This information helps a business plan a sales target, judge the financial risk of a new venture and consider the effect of changing prices or costs. It is an estimate, not a guarantee that all goods will be sold.
A historical example reports that Universal Music Group (UMG) had revenue of €5.26 billion and costs before interest, tax and amortisation of €4.616 billion. The difference is €0.644 billion (€644 million) on those stated figures. This illustrates why a firm compares revenue and costs, but it is not necessarily a measure of final net profit.
Cone Street Cycles
In the historical 2015 case, the Islamabad bicycle assembler has Rs 20,000,000 fixed costs, makes and sells 10,000 bicycles, and incurs Rs 2,000 variable cost per bicycle. Its total revenue is Rs 40,000,000.
| Item | Calculation | Amount |
|---|---|---|
| Fixed cost | Given | Rs 20,000,000 |
| Variable cost | 10,000 × Rs 2,000 | Rs 20,000,000 |
| Total costs | 20,000,000 + 20,000,000 | Rs 40,000,000 |
| Total revenue | Given | Rs 40,000,000 |
| Profit or loss | TR − TC | Rs 0 · Break even |
The firm breaks even because sales revenue equals total costs exactly. If sales were lower with its costs otherwise unchanged, it could make a loss.
Calculating the Break-even Point
A business can calculate its break-even output without drawing a chart if it knows its fixed costs, selling price per unit and variable cost per unit.
Contribution
Contribution per unit = selling price per unit − variable cost per unit. It is the amount earned from each unit sold that is available to cover fixed costs; once fixed costs are covered, further contribution adds to profit, under the simple model.
Equivalently: Break-even output = Fixed costs ÷ Contribution per unit. If the answer is not a whole unit, round up to the next whole unit for products that cannot be sold in fractions.
Ed Winchester: Fire Alarm Calculations
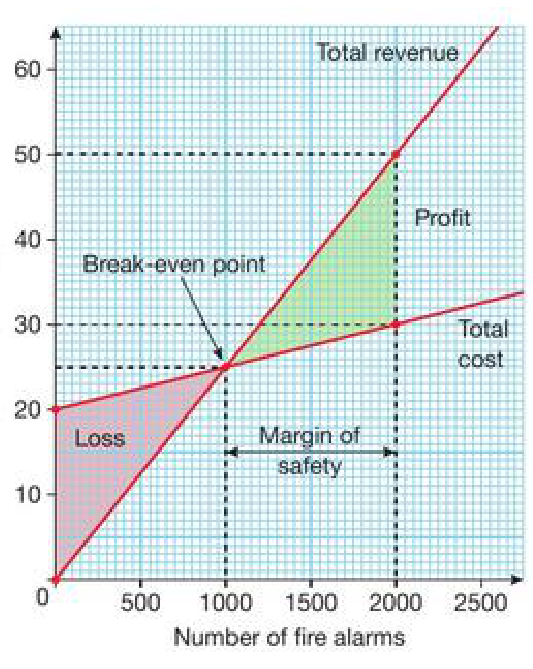
Ed Winchester installs fire alarms in council houses. Each installation has a selling price of US$25 per installation, variable cost of US$5 and fixed costs of US$20,000.
| Step | Calculation | Result |
|---|---|---|
| 1. Contribution per alarm | US$25 − US$5 | US$20 |
| 2. Break-even installations | US$20,000 ÷ US$20 | 1,000 alarms |
| 3. Revenue at break even | 1,000 × US$25 | US$25,000 |
| 4. Total costs at break even | US$20,000 + (1,000 × US$5) | US$25,000 |
If Ed installs 2,000 alarms, revenue is US$50,000 and total cost is US$30,000, giving a US$20,000 profit. Break even requires 1,000 installations; above that level the business earns profit while the assumptions remain unchanged.
Galle Ice Cream
Galle Ice Cream Ltd in Sri Lanka sells its standard ice cream for Rs 100 per kilogram. Fixed costs are Rs 100,000 and variable costs are Rs 50 per kilogram. Contribution is Rs 50 per kg, so break-even output is 100,000 ÷ 50 = 2,000 kg. At that level, total revenue and total costs are each Rs 200,000.
If fixed costs fall to Rs 80,000, the new break-even output is 80,000 ÷ 50 = 1,600 kg. Lower fixed costs mean fewer kilograms must be sold to cover all costs.
Break-even Chart
A break-even chart shows where revenue equals total costs. The horizontal axis shows the number of units sold. The vertical axis shows monetary values for total revenue (TR) and total cost (TC). The lines intersect at the break-even point.
- Revenue line: rises from zero as units are sold; its gradient reflects selling price per unit.
- Total-cost line: starts at fixed costs even when output is zero, then rises as variable costs increase.
- Loss region: at output below break even, the TC line is above the TR line.
- Profit region: above break even, TR is greater than TC. The vertical difference between the lines represents profit.
Margin of Safety
The margin of safety measures how far actual or expected sales are above the break-even level. It shows how much sales can fall before the business starts to make a loss.
If Ed installs 2,000 alarms and breaks even at 1,000, the margin of safety is 1,000 alarms. Sales could fall by 1,000 installations before reaching break even, assuming no change in costs or selling price.
The Grand Hotel
The Grand Hotel in Singapore has 600 rooms. The example chart uses an average room price of SGD 100. It shows fixed costs of about SGD 15,000 and break even at 300 occupied rooms, where total revenue and total costs are both SGD 30,000.
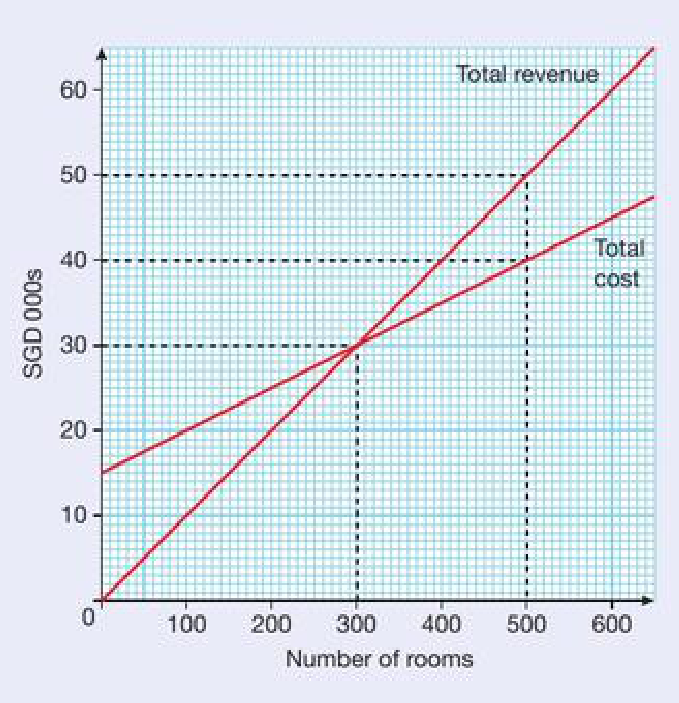
If 500 rooms are occupied, total revenue is SGD 50,000, total cost approximately SGD 40,000, and profit approximately SGD 10,000. Margin of safety = 500 − 300 = 200 rooms. These are figures read from the historical chart, not current hotel prices.
Check your understanding · Halfway
Try each question yourself before revealing the suggested answer.
What does a business mean by its break-even point?
Show suggested answer
It is the sales/output level at which total revenue exactly equals total costs, so profit and loss are both zero.
Cone Street Cycles has fixed costs of Rs 20 million and makes 10,000 bicycles costing Rs 2,000 each in variable costs. If revenue is Rs 40 million, has it broken even?
Show suggested answer
Variable costs = 10,000 × Rs 2,000 = Rs 20 million. Total costs = Rs 20 million + Rs 20 million = Rs 40 million, equal to revenue. Yes, it has broken even.
Define contribution per unit and calculate it when selling price is US$25 and variable cost is US$5.
Show suggested answer
Contribution = selling price − variable cost per unit = US$25 − US$5 = US$20 per unit.
Ed Winchester has fixed costs of US$20,000 and contribution of US$20 per installation. Calculate break-even output.
Show suggested answer
20,000 ÷ 20 = 1,000 alarm installations.
Galle Ice Cream sells at Rs 100/kg, has variable costs of Rs 50/kg and fixed costs of Rs 100,000. Calculate the break-even number of kilograms.
Show suggested answer
Contribution = Rs 100 − Rs 50 = Rs 50. Break-even output = 100,000 ÷ 50 = 2,000 kilograms.
What does margin of safety mean? Calculate it for 2,000 sales when the break-even output is 1,000.
Show suggested answer
Margin of safety is sales above the break-even level. 2,000 − 1,000 = 1,000 units.
Constructing a Break-even Chart
A break-even chart can be constructed from two points for each straight line. First calculate break even so you know where the lines should cross; then calculate revenue and total cost at convenient output values.
Nanjing Holdings: Drawing a Chart
Nanjing Holdings assembles circuit boards. For example, US$10,000 fixed costs, US$10 variable cost per board and a US$20 selling price per board. Contribution is US$10, so break-even output = 10,000 ÷ 10 = 1,000 boards.
| Output | Total cost (TC) | Total revenue (TR) |
|---|---|---|
| 0 | US$10,000 | US$0 |
| 1,000 | US$20,000 | US$20,000 |
| 2,000 | US$30,000 | US$40,000 |
- Step 1: Draw and label the axes. Output is on the horizontal axis; cost and revenue are on the vertical axis.
- Step 2: Plot revenue points (0, 0) and (2,000, 40,000); connect them with a straight line.
- Step 3: Plot total-cost points (0, 10,000) and (2,000, 30,000); join them with a straight line.
- Step 4: Read the intersection at 1,000 boards and US$20,000. Label the profit and loss regions if useful.
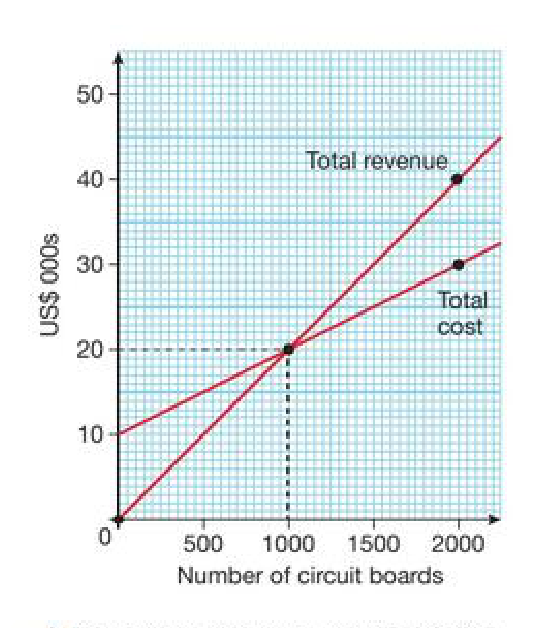
Calculation note: the total-cost line starts at the fixed-cost amount when output is zero. Table 28.1 and Figure 28.3 use US$10,000 at that point. At higher output, variable costs are added to fixed costs.
Effect of Changes in Price and Costs on the Break-even Chart
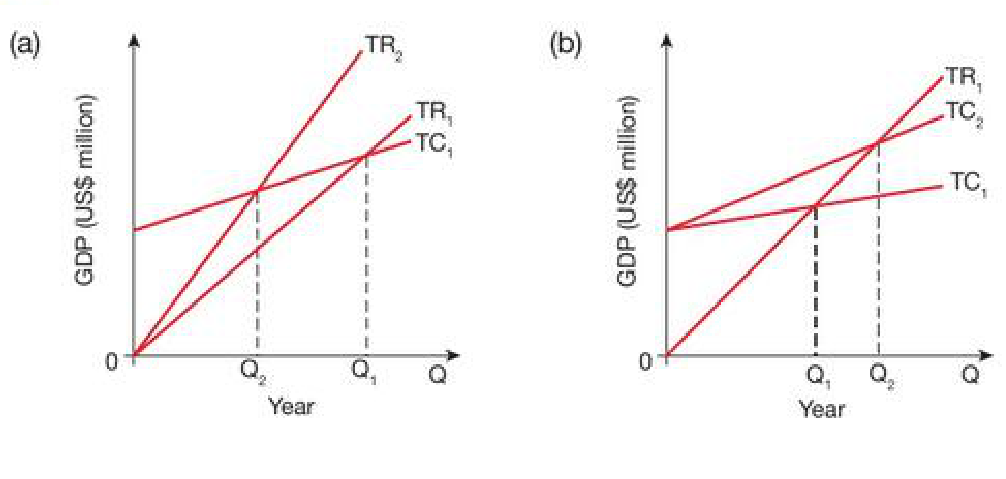
Break-even analysis also shows how business decisions and changing costs can alter the output required to avoid a loss. The new break-even point is found where the updated revenue and total-cost lines intersect.
Changes in Selling Price
If price rises while variable cost per unit and fixed costs stay unchanged, contribution increases and the break-even output falls: the revenue line becomes steeper and the intersection moves left. A price reduction has the opposite effect and moves break even to the right. However, a higher price could reduce demand, so selling more at the new price cannot be assumed.
Changes in Fixed Costs
If fixed costs rise, the total-cost line shifts upwards without changing its slope and the break-even output rises. If fixed costs fall, it shifts downwards and break even falls. Examples include increased rent or reduced overheads.
Changes in Variable Costs
A rise in variable cost per unit makes the total-cost line steeper. With selling price fixed, contribution falls and more output is needed to break even. A fall in variable cost has the opposite effect. Bulk purchasing may reduce the cost of ingredients or components per unit.
| Change (other factors unchanged) | What happens to break-even output? |
|---|---|
| Higher selling price | Usually falls |
| Lower selling price | Usually rises |
| Higher fixed costs | Rises |
| Lower fixed costs | Falls |
| Higher variable cost per unit | Rises |
| Lower variable cost per unit | Falls |
If the selling price remains Rs 100 and variable cost rises from Rs 50 to Rs 60 per kg, contribution falls from Rs 50 to Rs 40. With fixed costs of Rs 100,000, break-even output rises from 2,000 kg to 2,500 kg (100,000 ÷ 40).
The Limitations of a Break-even Chart
A break-even chart is useful for estimating the output needed to cover costs, and for comparing potential prices and costs. However, it is only as reliable as its assumptions and the information used to prepare it.
- Straight-line assumptions: in reality, total revenue may not rise proportionally with output because large orders may receive discounts. Costs may not remain linear; bulk buying may lower variable costs at high output.
- Production is not necessarily sales: the model usually assumes everything produced will be sold, but businesses may hold finished stock, face changing demand or deliberately stockpile goods.
- Data quality: inaccurate forecasts of sales prices, input costs or demand lead to misleading conclusions.
- Changing circumstances: competitors, technology, inflation and supply disruptions may change the estimated figures.
Managers should combine break-even analysis with realistic sales forecasts, cash-flow forecasts and other financial and market information. For example, a calculated break-even output may be mathematically correct but impossible to sell if expected demand is too low.
Large vs Small Businesses
Break-even analysis is useful to both large and small businesses. For a small start-up, breaking even in its first year can be an important initial objective; owners compare total revenue with total costs to see whether they have achieved it.
Large businesses may have financial specialists who use break-even analysis more formally to assess a new product, investment or business venture. Smaller owners may use simpler calculations, but they still need to know how many units must be sold to cover their costs.
Smaller businesses
- Useful for setting an early sales target and avoiding losses.
- Often limited finance and less capacity to absorb underperformance.
- May rely on a simple formula rather than detailed financial software.
Larger businesses
- Can evaluate alternative products, plants or projects.
- May have finance specialists and more detailed cost data.
- Complex ranges of products make assumptions less straightforward.
End-of-chapter questions
Try each question yourself before revealing the suggested answer.
Explain why total revenue and total costs intersect at the break-even point.
Show suggested answer
At that output, revenue from sales is exactly enough to pay all fixed and variable costs. Profit = TR − TC = 0.
Read the Grand Hotel break-even chart: identify fixed costs and approximate break-even occupancy.
Show suggested answer
Fixed costs are approximately SGD 15,000. The lines cross at around 300 occupied rooms, where total revenue equals total costs.
At 500 occupied rooms, the Grand Hotel has revenue SGD 50,000 and total costs SGD 40,000. Calculate profit and margin of safety.
Show suggested answer
Profit = 50,000 − 40,000 = SGD 10,000. Margin of safety = 500 − 300 = 200 rooms.
Nanjing Holdings has fixed costs of US$10,000, a selling price of US$20 and variable costs of US$10 per board. Find break-even output.
Show suggested answer
Contribution = 20 − 10 = US$10. Break-even output = US$10,000 ÷ US$10 = 1,000 boards.
Using Nanjing’s figures, calculate total cost and total revenue at an output of 2,000 boards.
Show suggested answer
TC = US$10,000 + (2,000 × US$10) = US$30,000. TR = 2,000 × US$20 = US$40,000. Profit = US$10,000.
Explain how a reduction in selling price affects a break-even chart, assuming costs do not change.
Show suggested answer
The total-revenue line becomes flatter; contribution per unit decreases, so the intersection with the total-cost line shifts right and break-even output rises.
Describe the effect of higher fixed costs on the chart.
Show suggested answer
The total-cost line shifts upwards without changing its slope. The break-even output rises because more contribution is needed to cover higher fixed costs.
Galle Ice Cream’s variable cost rises from Rs 50 to Rs 60 per kilogram. If its price remains Rs 100 and fixed costs Rs 100,000, find the new break-even output.
Show suggested answer
New contribution = 100 − 60 = Rs 40; break even = 100,000 ÷ 40 = 2,500 kg (up from 2,000 kg).
Identify two limitations of break-even analysis and explain why they matter.
Show suggested answer
It often assumes all output is sold even if demand is weak, and that prices and costs are linear even though discounts or bulk buying may change them. Both assumptions can cause the forecast to be inaccurate.
A product sells for €150, its variable cost is €90 per unit and annual fixed costs are €24,000. Calculate contribution per unit and break-even output.
Show suggested answer
Contribution per unit = €150 − €90 = €60. Break-even output = €24,000 ÷ €60 = 400 units.
If the business in Question 10 sells 650 units, calculate predicted profit and margin of safety. Explain one limitation of the prediction.
Show suggested answer
Revenue = €97,500; variable costs = €58,500; total costs = €82,500; predicted profit = €15,000. Margin of safety = 650 − 400 = 250 units. Actual demand, costs or prices may differ from assumptions.
Chapter 28 recap
Break even occurs when total revenue equals total costs. Contribution per unit is price minus variable cost per unit, so break-even output = fixed costs ÷ contribution per unit. On a chart, the cost and revenue lines intersect at break even. The margin of safety is sales above break even. Test assumptions about prices, costs and demand before relying on the result.
Educational adaptation of Pearson Edexcel International GCSE (9–1) Business, Chapter 28 (source pp. 231–237). Examples and figures are for revision; historical figures do not describe current company performance. IGCSE360 is an independent learning resource and is not affiliated with Pearson.